Important Information
You are visiting the international Vantage Markets website, distinct from the website operated by Vantage Global Prime LLP
( www.vantagemarkets.co.uk ) which is regulated by the Financial Conduct Authority ("FCA").
This website is managed by Vantage Markets' international entities, and it's important to emphasise that they are not subject to regulation by the FCA in the UK. Therefore, you must understand that you will not have the FCA’s protection when investing through this website – for example:
- You will not be guaranteed Negative Balance Protection
- You will not be protected by FCA’s leverage restrictions
- You will not have the right to settle disputes via the Financial Ombudsman Service (FOS)
- You will not be protected by Financial Services Compensation Scheme (FSCS)
- Any monies deposited will not be afforded the protection required under the FCA Client Assets Sourcebook. The level of protection for your funds will be determined by the regulations of the relevant local regulator.
If you would like to proceed and visit this website, you acknowledge and confirm the following:
- 1.The website is owned by Vantage Markets' international entities and not by Vantage Global Prime LLP, which is regulated by the FCA.
- 2.Vantage Global Limited, or any of the Vantage Markets international entities, are neither based in the UK nor licensed by the FCA.
- 3.You are accessing the website at your own initiative and have not been solicited by Vantage Global Limited in any way.
- 4.Investing through this website does not grant you the protections provided by the FCA.
- 5.Should you choose to invest through this website or with any of the international Vantage Markets entities, you will be subject to the rules and regulations of the relevant international regulatory authorities, not the FCA.
Vantage wants to make it clear that we are duly licensed and authorised to offer the services and financial derivative products listed on our website. Individuals accessing this website and registering a trading account do so entirely of their own volition and without prior solicitation.
By confirming your decision to proceed with entering the website, you hereby affirm that this decision was solely initiated by you, and no solicitation has been made by any Vantage entity.
I confirm my intention to proceed and enter this website Please direct me to the website operated by Vantage Global Prime LLP regulated by the FCA in the United KingdomImportant Information
By providing your email and proceeding to create an account on this website, you acknowledge that you will be opening an account with Vantage Global Limited, regulated by the Vanuatu Financial Services Commission (VFSC), and not the UK Financial Conduct Authority (FCA).
-
Please enter a valid email address
-
Please tick the checkbox to proceed
-
Please tick the checkbox to proceed
Please tick all to proceed

Access Restricted
Your access to this website is restricted.
Our website and services are not available to, and are not intended for, individuals who are citizens or residents of the United States, or entities incorporated in or conducting business within the United States.
If this does not apply to you and you believe you have received this message in error, please contact us at support@vantagemarkets.com for further assistance.
If you fall into any of the above categories, please exit the site.
Important Information
Thank you for visiting the Vantage Markets website. Please note that this website is intended for individuals residing in jurisdictions where accessing it is permitted by Vantage and its affiliated entities do not operate in your home jurisdiction.
By clicking 'I CONFIRM MY INTENTION TO PROCEED AND ENTER THIS WEBSITE', you confirm that you are entering this website solely based on your initiative and not as a result of any specific marketing outreach. You wish to obtain information from this website based on reverse solicitation principles, in accordance with the applicable laws of your home jurisdiction.
I CONFIRM MY INTENTION TO PROCEED AND ENTER THIS WEBSITE
-

-


Download App
-


-

-

-
Search query too short. Please enter a full word or phrase.
-

Keywords
Popular Search








Language


Economic news todayFeatured NewsFederal Reserve NewsFinancial NewsForexForex NewsInterest Rate NewsMarket News TodayTechnical AnalysisUSDJPY NewsUSDX News
Why the US Dollar Index Slipped as the Euro and Yen Firmed – USDX Analysis

Vantage Editorial Team >
22 October 2026 | Indices | 16 min read
Vantage Editorial Team >
Vantage is a global, multi-asset broker with a team of experienced in-house writers, analysts, and market professionals. Together, they craft trusted, educational, and market-driven content tailored for traders at every stage—from beginner to pro.
Key Takeaways
- The US dollar index current reading on the Vantage feed was 101.601 as of 09:53 (GMT+8) on 21 October 2026, below both its 50-hour and 200-hour moving averages.
- The Intercontinental Exchange (ICE) US Dollar Index touched 102.94 after the 14 October Consumer Price Index (CPI) report, then slipped to around 101.50 on 20 October, a three-week low. 1,6
- As of 20 October, markets priced about an 83% chance of a Federal Reserve hold on 28 October and a 94% chance of a December hike. 6
The US dollar index today sits at 101.601 on the Vantage USDX feed as of 09:53 (GMT+8) on 21 October 2026, below where it stood before last week’s hot September CPI report. That print sent the DXY index to an 18-month high. 2 A week on, the rally has gone, yet markets still price a December hike. 6
So what happened? Two things, in order. First, bets on an October move by the Federal Reserve (Fed) faded, taking the air out of the CPI spike. Then, on 19 and 20 October, the euro and yen appeared to take over the steering. For anyone following US dollar index news, that second leg is the one most headlines missed.
Instrument Snapshot: As of 09:53 (GMT+8) on 21 October 2026, the Vantage USDX price was 101.601, 0.02% higher on the hourly bar; the ICE US Dollar Index’s 52-week range is 95.55 to 102.94. 10
The Short Answer: Why the US Dollar Index Slipped
The US dollar index gave back its CPI rally as October hike bets faded, falling to a two-week low on 16 October. It then slipped to a three-week low on 20 October as the euro steadied and the yen firmed after record Japanese bond demand.
Table 1: What Moved the US Dollar Index, 14 to 21 October 2026
| Date | US Dollar/USDX – Index | What Moved It | Fed Pricing |
| 14 October | ICE high 102.94; 1 Vantage high near 102.70 | CPI 3.7% year on year vs 3.6% expected 4 | 65% chance of an October hold 1 |
| 16 October | ICE near 101.6, a two-week low; 6 Vantage low near 101.37 | Warsh declined to signal the October outcome 6 | October hike bets faded 6 |
| 19 October | ICE up 0.2% to 101.98 7 | French protests weighed on the euro 7 | About 84% chance of an October hold 6 |
| 20 October | ICE near 101.50, a three-week low 6 | Euro steadied, yen firmed after a record-demand bond auction; 8 weak US housing data 6 | 83% hold; 94% December hike 6 |
| 21 October, 09:53 (GMT+8) | Vantage 101.601 | Quiet Asia session | Latest cited reading: 94% December hike (20 October) 6 |
Table 1 sources: Reuters, Yahoo Finance, Trading Economics, Business Recorder, and the Vantage USDX chart, accessed 21 October 2026. ICE spot and Vantage prices differ slightly by venue.
Hot Inflation Lifted the DXY Index, Then Let Go
The spike had a clear trigger. US consumer prices rose 3.7% from a year earlier in September, up from 3.4% in August and above the 3.6% economists expected. 4 Gasoline alone accounted for more than half of the monthly rise, and core CPI climbed 2.6% against a 2.5% forecast. 3 Principal Asset Management’s Seema Shah said the data reinforced the view that “inflation remains too persistent for the Fed to declare victory”. 4
The DXY index jumped to 102.94, its highest since April 2025. 1,2 Mesirow Currency Management’s Uto Shinohara told Reuters that October rate expectations jumped after the release, “bringing the meeting more into play”. 2 By that afternoon, though, the index was easing again, with a 65% chance of no October move priced. 1
If you had the USDX chart live that night, the Vantage price ran from near 102.00 to near 102.70 on 14 October, and the 14-period Relative Strength Index (RSI) jumped above 80, then sank to near 30 by 15 October. Overbought to nearly oversold in a day: roughly the shelf life of that CPI excitement.
Hot inflation explains the spike. It doesn’t explain why the dollar index then fell below where it started.
Federal Reserve Hike Bets Moved to December
The tempting explanation is that hike bets collapsed. They didn’t. The Fed lifted its policy range to 3.75% to 4.00% on 16 September in a 12-0 vote, 5 and on 20 October markets priced a 94% chance of another hike in December, against an 83% chance of a hold this month. 6 The hike moved on the calendar, not off it.
It’s a global cycle, too: the Fed, the European Central Bank (ECB), and the Bank of Japan (BoJ) all raised rates within eight days in September. Then, on Friday 16 October, Fed Chair Kevin Warsh declined to signal this month’s outcome, saying hotter inflation had not changed his view of the economy, and the index fell to around 101.6, a two-week low. 6 That is where most of the CPI rally went: the premium for an early move lost its footing.
US data didn’t help either. On 20 October the index hit around 101.50, a three-week low, as housing starts fell 5.2% in September, pending home sales dropped to a record low, and oil eased on hopes for a diplomatic path in the Middle East conflict. 6 Those factors explain part of that second leg. The rest sat abroad, because most of the dollar index does.
The Euro and Yen Did the Heavy Lifting
Here’s the detail that changes how the USDX index reads. The euro carries 57.6% of the six-currency basket, ahead of the yen at 13.6%, the pound at 11.9%, the Canadian dollar at 9.1%, the Swedish krona at 4.2%, and the Swiss franc at 3.6%, 6 a mix fixed since 1999. 9 By weight, it’s mostly a euro index wearing a US flag.
That weighting showed up on cue. Violent weekend protests in France weighed on the euro on Monday 19 October, and the French-German 10-year yield spread widened 9.9 basis points to 147.3 basis points. 7 The dollar index rose 0.2% to 101.98 that day, and the US 10-year Treasury yield was flat at 5.131% in early Asian trade the next morning. 7 Even so, Pepperstone’s Chris Weston said “the euro’s resilience suggests traders aren’t yet treating it as a systemic European problem”. 7,14
Then the unrest eased. On Tuesday the euro steadied, the yen jumped after a Japanese bond auction drew record demand, and the dollar index slipped to 101.85 as USDJPY eased to 158.14. 8 On the Vantage chart, the 19 October push to near 101.87 and the 20 October dip to near 101.30 match those headlines far better than any shift in Fed pricing.
For those two sessions, the dollar index followed Paris and Tokyo more closely than Fed pricing, which is exactly what a combined 71.2% euro and yen weighting allows.
The December hike is still priced. What faded was October, and 71.2% of the index is euro and yen.
That’s the driver picture. Now for what it did to the chart.
USDX Chart: Below Both Hourly Averages
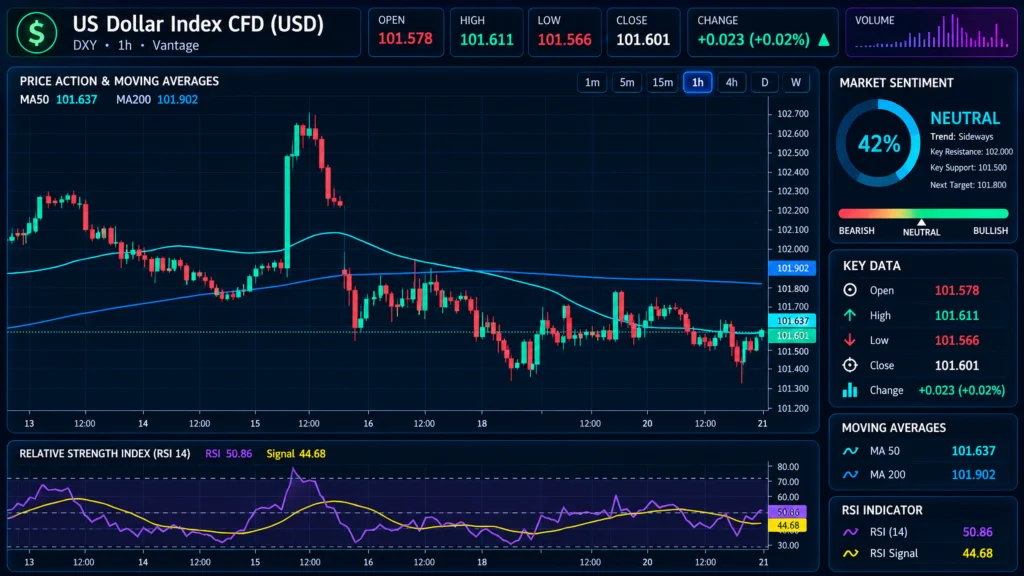
As of 09:53 (GMT+8) on 21 October 2026, the dollar index USDX reading of 101.601 sat just under the 50-hour moving average near 101.64 and below the 200-hour average near 101.90 on the TradingView setup used for this analysis. The faster line crossed beneath the slower one around 15 October and has drifted lower since.
Price climbed off the 20 October low near 101.30, the lowest point in the window, within hours. RSI read 50.86 at the cut-off, back at the midline and above its own moving average of 44.68. Momentum has firmed; price hasn’t cleared the 50-hour average 0.036 overhead, roughly one candle wick.
Table 2: USDX Levels Traders Are Watching, as of 09:53 (GMT+8), 21 October 2026
| Level | US Dollar/USDX – Index (Vantage Feed) | What It Marks on the H1 Chart |
| Upper Reference 1 | Near 102.70 | 14 October CPI-day high |
| Upper Reference 2 | Near 101.90 | 200-hour moving average |
| Upper Reference 3 | Near 101.87 | 19 October high |
| Nearest Overhead | Near 101.64 | 50-hour moving average |
| Lower Reference 1 | Near 101.37 | 16 October low |
| Lower Reference 2 | Near 101.30 | 20 October low, lowest in the chart window |
Table 2: Levels read from the Vantage USDX H1 chart as of 09:53 (GMT+8), 21 October 2026. Source: TradingView setup used for this analysis. Indicative only, not trade signals.
Those are the lines on the chart. Next week’s calendar is where the euro and Fed stories meet again.
Three Central Banks in Two Days
In GMT+8 terms, the Fed, ECB, and BoJ all decide on 29 and 30 October. Here’s the forex news today calendar on our radar:
- Fed Decision, 29 October 2026, 02:00 (GMT+8): The statement lands at that hour; 11 with a hold largely priced, 6 the December language may say more than the decision.
- US Q3 Gross Domestic Product (GDP) and September Personal Consumption Expenditures (PCE), 29 October 2026, 20:30 (GMT+8): PCE is the Fed’s preferred inflation gauge. 6
- ECB Decision, 29 October 2026, 21:15 (GMT+8): Day two of the 28 to 29 October meeting, 12 and the euro is 57.6% of the index.
- BoJ Decision, 30 October 2026: Policy decision and Outlook Report after a two-day meeting; 13 the yen is 13.6% of the index.
- French Political Headlines, Ongoing: The 19 and 20 October sessions showed how quickly Paris reached the index. 7,8
Our read is that October hike timing drove the CPI give-back and the euro and yen drove the latest leg. It weakens if December hike pricing shifts sharply after the Fed statement, putting US rates back in charge, or if USDX holds above both hourly averages while the euro stays calm, which would point to dollar-specific demand.
US Dollar Index Ticker, Basket, and Futures FAQ
What is the ticker symbol for the US dollar index?
DXY is the US dollar index ticker most data providers use for the spot index, while USDX futures trade on ICE Futures U.S. under the symbol DX. 9 Vantage quotes it as USDX. Three labels, one basket.
Which currencies make up the US dollar index?
Six: the euro, Japanese yen, British pound, Canadian dollar, Swedish krona, and Swiss franc, with the euro at 57.6% of the weighting. 6,9
Is USDX the same as DXY?
Same basket, so you’ll see it as US dollar index USDX or DXY, but quotes differ by venue: on 21 October, the Vantage USDX price sat about 0.19 below the ICE spot level of roughly 101.79. 6
Gap Risk Around a 02:00 Federal Reserve Decision
Back to the puzzle: how did hot CPI and a hiking Fed fail to hold the dollar index up? The hike didn’t disappear; it moved to December, which took the CPI spike with it, and the euro and yen then set the pace for the latest leg lower.
The index’s sleepy reputation didn’t survive the week: from near 102.70 on 14 October to near 101.30 on 20 October, the Vantage USDX price covered roughly 1.36%. The Fed decision lands at 02:00 (GMT+8), when much of Asia is offline.
A Stop Loss can limit a loss to a planned size, though a fast move around a central bank decision can fill it at a worse price than the level set, and positions held through 29 and 30 October face that gap risk three times. Our forex risk management guide explains how gaps affect stop orders.
Leverage on index and forex CFDs magnifies gains and losses alike. At an illustrative 1:100 setting, a 1% move in USDX equals 100% of the margin posted, which is why position size in proportion to account equity matters most in weeks packed with scheduled decisions.
Related Reading
- US Dollar Index News
- Fed, ECB and BoJ Hikes: Why They Moved Within Eight Days
- Forex Risk Management: Strategies, Tools and Examples
RISK WARNING: CFDs are complex financial instruments and carry a high risk of losing money rapidly due to leverage. You should ensure you fully understand the risks involved and carefully consider whether you can afford to take the high risk of losing your money before trading.
Disclaimer: The information is provided for educational purposes only and doesn’t take into account your personal objectives, financial circumstances, or needs. It does not constitute investment advice. We encourage you to seek independent advice if necessary. The information has not been prepared in accordance with legal requirements designed to promote the independence of investment research. No representation or warranty is given as to the accuracy or completeness of any information contained within. This material may contain historical or past performance figures and should not be relied on. Furthermore estimates, forward-looking statements, and forecasts cannot be guaranteed. The information on this site and the products and services offered are not intended for distribution to any person in any country or jurisdiction where such distribution or use would be contrary to local law or regulation.
References
[1] “Dollar hits 18-month high, then cools as investors await patient Fed – Reuters via Euronext” https://live.euronext.com/en/financial-news/dollar-hits-18-month-high-then-cools-investors-await-patient-fed Accessed on 21 October 2026.
[2] “Dollar Hits Fresh 18-Month High as Hot Inflation Boosts Fed Hike Expectations – Reuters via GV Wire” https://gvwire.com/2026/10/14/dollar-hits-fresh-18-month-high-as-hot-inflation-boosts-fed-hike-expectations/ Accessed on 21 October 2026.
[3] “September CPI report shows inflation accelerated to 3.7% as energy costs soared – CBS News” https://www.cbsnews.com/news/september-cpi-report-inflation-energy-costs/ Accessed on 21 October 2026.
[4] “Surging gas prices pushed CPI inflation to 3.7% in September. The Fed is watching. – Yahoo Finance” https://finance.yahoo.com/economy/article/surging-gas-prices-pushed-cpi-inflation-to-37-in-september-the-fed-is-watching-133518198.html Accessed on 21 October 2026.
[5] “Federal Reserve Press Release, 16 September 2026 – Federal Reserve Board” https://www.federalreserve.gov/newsevents/pressreleases/monetary20260916a.htm Accessed on 21 October 2026.
[6] “United States Dollar – Quote – Chart – Historical Data – News – Trading Economics” https://tradingeconomics.com/united-states/currency Accessed on 21 October 2026.
[7] “Dollar and euro drift, yen slips as markets seek direction – Business Recorder” https://www.brecorder.com/news/40445070/dollar-and-euro-drift-yen-slips-as-markets-seek-direction Accessed on 21 October 2026.
[8] “Euro steadies as French protests ease; pound and yen firm – Reuters via Yahoo Finance” https://finance.yahoo.com/markets/currencies/articles/yen-jumps-jgb-auction-draws-062414344.html Accessed on 21 October 2026.
[9] “USDX Futures, Mini USDX Futures, USDX Options – ICE” https://status.ice.com/forex/usdx Accessed on 21 October 2026.
[10] “US Dollar Index Historical Data (DXY) – Investing.com” https://www.investing.com/indices/usdollar-historical-data Accessed on 21 October 2026.
[11] “FOMC Meeting Calendars, 2026 – Federal Reserve Board” https://www.federalreserve.gov/monetarypolicy/fomccalendars.htm Accessed on 21 October 2026.
[12] “Schedules for the meetings of the Governing Council and General Council of the ECB – European Central Bank” https://www.ecb.europa.eu/press/calendars/mgcgc/html/index.en.html Accessed on 21 October 2026.
[13] “Bank of Japan Rate Decision October 2026 – Finance Calendar” https://www.financecalendar.com/?p=1256 Accessed on 21 October 2026.
[14] “Dollar Steadies As Yen Slips, French Political Risks Weigh On Euro – Business Today” https://www.businesstoday.com.my/2026/10/20/dollar-steadies-as-yen-slips-french-political-risks-weigh-on-euro/ Accessed on 21 October 2026.
Key Points In This Article

Latest Financial Market Analysis


Market Analysis Tags
- # USD News
- # USDCAD News
- # USDJPY News
- # USDX News
- # Forex News
- # Forex News Today
- # GBPUSD News
- # EURUSD News
- # Currency Trading News
- # AUDUSD news
Related Articles
- Why the Dow Jones Rose as Healthcare Lifted Blue Chips – DJ30 Analysis
- Tesla Stock Price Today: Q3 Earnings and SpaceX Merger Talk, and What It Means for TSLA Traders
- Why the S&P 500 Climbed as AI Stocks Rebounded – SP500 Analysis
- Why the US Dollar Index Slipped as Fed Hike Bets Faded – USDX Analysis
- Netflix Stock Price Today: Flat After 1,000 Job Cuts Before Q3 Earnings, and What It Means for NFLX Traders
- Why Gold Climbed as Yields Fell Despite Hot Inflation – XAUUSD Analysis
- Why Crude Oil Prices Slipped as the US Weighed Tanker Sanctions Relief – UKOUSD and USOUSD Analysis
- Week Ahead: Earnings Hot Up Amid Market Volatility