Important Information
You are visiting the international Vantage Markets website, distinct from the website operated by Vantage Global Prime LLP
( www.vantagemarkets.co.uk ) which is regulated by the Financial Conduct Authority ("FCA").
This website is managed by Vantage Markets' international entities, and it's important to emphasise that they are not subject to regulation by the FCA in the UK. Therefore, you must understand that you will not have the FCA’s protection when investing through this website – for example:
- You will not be guaranteed Negative Balance Protection
- You will not be protected by FCA’s leverage restrictions
- You will not have the right to settle disputes via the Financial Ombudsman Service (FOS)
- You will not be protected by Financial Services Compensation Scheme (FSCS)
- Any monies deposited will not be afforded the protection required under the FCA Client Assets Sourcebook. The level of protection for your funds will be determined by the regulations of the relevant local regulator.
If you would like to proceed and visit this website, you acknowledge and confirm the following:
- 1.The website is owned by Vantage Markets' international entities and not by Vantage Global Prime LLP, which is regulated by the FCA.
- 2.Vantage Global Limited, or any of the Vantage Markets international entities, are neither based in the UK nor licensed by the FCA.
- 3.You are accessing the website at your own initiative and have not been solicited by Vantage Global Limited in any way.
- 4.Investing through this website does not grant you the protections provided by the FCA.
- 5.Should you choose to invest through this website or with any of the international Vantage Markets entities, you will be subject to the rules and regulations of the relevant international regulatory authorities, not the FCA.
Vantage wants to make it clear that we are duly licensed and authorised to offer the services and financial derivative products listed on our website. Individuals accessing this website and registering a trading account do so entirely of their own volition and without prior solicitation.
By confirming your decision to proceed with entering the website, you hereby affirm that this decision was solely initiated by you, and no solicitation has been made by any Vantage entity.
I confirm my intention to proceed and enter this website Please direct me to the website operated by Vantage Global Prime LLP regulated by the FCA in the United KingdomImportant Information
By providing your email and proceeding to create an account on this website, you acknowledge that you will be opening an account with Vantage Global Limited, regulated by the Vanuatu Financial Services Commission (VFSC), and not the UK Financial Conduct Authority (FCA).
-
Please enter a valid email address
-
Please tick the checkbox to proceed
-
Please tick the checkbox to proceed
Please tick all to proceed

Access Restricted
Your access to this website is restricted.
Our website and services are not available to, and are not intended for, individuals who are citizens or residents of the United States, or entities incorporated in or conducting business within the United States.
If this does not apply to you and you believe you have received this message in error, please contact us at support@vantagemarkets.com for further assistance.
If you fall into any of the above categories, please exit the site.
Important Information
Thank you for visiting the Vantage Markets website. Please note that this website is intended for individuals residing in jurisdictions where accessing it is permitted by Vantage and its affiliated entities do not operate in your home jurisdiction.
By clicking 'I CONFIRM MY INTENTION TO PROCEED AND ENTER THIS WEBSITE', you confirm that you are entering this website solely based on your initiative and not as a result of any specific marketing outreach. You wish to obtain information from this website based on reverse solicitation principles, in accordance with the applicable laws of your home jurisdiction.
I CONFIRM MY INTENTION TO PROCEED AND ENTER THIS WEBSITE
-

-


Download App
-


-

-

-
Search query too short. Please enter a full word or phrase.
-

Keywords
Popular Search








Language


Economic news todayEURUSD NewsFeatured NewsFederal Reserve NewsFinancial NewsForexForex NewsIndicesInterest Rate NewsMarket News TodayTechnical AnalysisUSD NewsUSDX News
Why the Dollar Index Fell as Midterm Results Rolled In – USDX Analysis

Vantage Editorial Team >
5 November 2026 | Indices | 16 min read
Vantage Editorial Team >
Vantage is a global, multi-asset broker with a team of experienced in-house writers, analysts, and market professionals. Together, they craft trusted, educational, and market-driven content tailored for traders at every stage—from beginner to pro.

Key Takeaways
- The dollar index (DXY) fell to 101.211 on Vantage’s USDX feed by 10:24 (GMT+8) on 4 November 2026, after touching a low near 101.10.
- On the hourly chart, the index sat below both its 50-period and 200-period moving averages, with the 14-period RSI at 25.94.
- The drop came as early US midterm results arrived, a day after CME FedWatch put the odds of a December Fed rate rise at 79%. 1
| Quick Answer: Why Did the Dollar Index Fall Today?The dollar index fell to 101.211 by 10:24 (GMT+8) on 4 November 2026 as early US midterm results pointed to Democratic gains. Markets read that as less fiscal support, outweighing 79% odds of a December Fed hike. The hourly chart turned lower before the vote. |
The dollar index fell to 101.211 by 10:24 (GMT+8) on 4 November 2026, and it did it with the Federal Reserve still leaning hawkish. A day earlier, futures markets priced a 79% chance of a December rate rise, 1 the sort of number that usually keeps a currency standing tall. Usually. Not this morning.
So what knocked the dollar index today? The short version: early US midterm results moved the conversation from interest rates to government spending, and the hourly chart shows the US dollar index was already leaning lower before a single race was called. Below, we walk through the latest dollar index news, the chart, the drivers, what three bank strategists are saying, and the levels worth watching.
Dollar index value as of today: 101.211 at 10:24 (GMT+8) on 4 November 2026 on Vantage’s USDX feed, about 0.48% below its last 3 November hourly close near 101.70. Trading Economics data showed the index 1.46% higher over the past 12 months. 2
The Dollar Index Chart Broke Its Weekly Floor
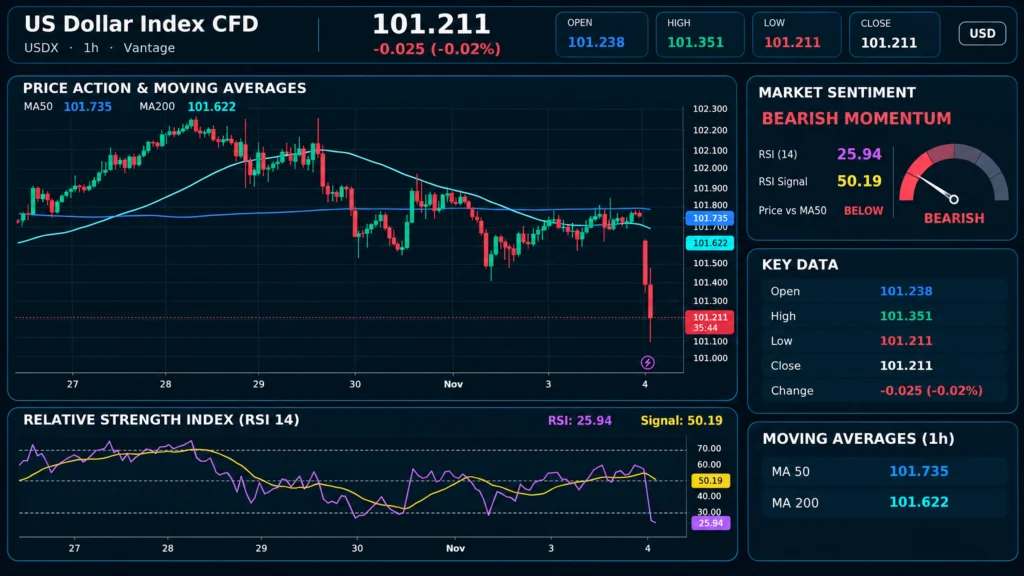
If you had a US dollar index live feed open, you saw the dollar index price slip through the bottom of a range it had held since 30 October. The last hourly candle of 3 November closed near 101.70. Trading reopened near 101.53 after a visible price gap, slid to around 101.10, and closed that hour near 101.24. The previous floor, a wick to roughly 101.26 on 2 November, lasted exactly one candle.
Here is the part we found most telling. On the US dollar index chart, built on the dollar index TradingView setup used for this analysis, the faster 50-period moving average sat at 101.622 and the slower 200-period average at 101.735. The faster line slipped under the slower one around 2 November, a full day before polls opened. The chart had changed lanes before anyone reached a ballot box.
Zoom out and the dollar index graph tells a bigger story. From the 28 October high near 102.32 to this morning’s low near 101.10, the index gave back about 1.22 points, or roughly 1.19% on our arithmetic. No hourly candle has closed above 102.00 since 29 October. Our dollar index technical analysis archive tracks this setup week by week.
On momentum, the DXY today looks even more stretched than on price. The 14-period Relative Strength Index (RSI) read 25.94, under the 30 line many chart readers treat as stretched, while its signal line sat at 50.19. Worth remembering: an RSI tells you how fast the index fell, not where it goes next. Indicators are historians, not fortune tellers.
The chart shows how far and how fast. It does not explain why the selling waited for Asia’s morning.
Midterm Results Moved the Spending Story
The timing lines up with the vote count. US polls close during the American evening, which is Asia’s morning, and by 00:30 GMT (08:30 GMT+8) US media had projected winners in a handful of House races. 3 FXStreet reported the DXY near 101.25 in early Asia trade as those first results pointed to Democratic gains. 4
The channel most strategists pointed to was fiscal rather than political. Carol Kong, currency strategist at Commonwealth Bank of Australia, told Reuters that a Democratic sweep “would limit government spending over Trump’s term,” a scenario in which she saw room for further US dollar weakness. 3 Less spending tends to mean less pressure on yields, and the US 10-year Treasury yield slipped 4 basis points to 4.919% in early Asia trading. 3
Interest rates had the microphone for weeks; on Wednesday morning, the spending debate grabbed it. Yet the Federal Reserve has not softened at all. On 28 October, the Federal Open Market Committee (FOMC) held the federal funds rate in a 3.75% to 4.00% range in a 10 to 2 vote, with Governors Lisa Cook and Beth Hammack preferring a quarter-point rise. 5 The statement called inflation elevated and said the Committee “will deliver price stability”. 5
A hawkish Fed and a falling dollar should not sit comfortably together. So why did they?
Why Fed Hike Bets Did Not Lift the Dollar
Read together, the chart and the calendar suggest the early count sped up a slide that was already under way. The index peaked near 102.32 around the 28 October Fed decision, then drifted lower through a week in which markets kept pricing a likely December rise. On 3 November, with those odds at 79%, the index only steadied around 101.8. 6
The early count supplied the speed. The chart had tilted lower two days before the first race was called.
Wells Fargo’s global head of FX strategy, Erik Nelson, put the puzzle neatly in a Reuters poll published on 3 November, saying the dollar “is definitely not keeping up with usual catalysts”. 7 In the same poll, Credit Agricole CIB’s head of G10 FX, Valentin Marinov, said investors would be watching for any sign of renewed escalation in the Middle East conflict after the vote, which he saw as the route by which the safe-haven dollar could regain its appeal. 7
How each driver pulled on the dollar index this morning:
| Driver | What Happened | Pull on the Dollar Index |
|---|---|---|
| Fed hike pricing | December hike odds at 79% on 3 November 1 | Supportive in theory, little visible lift |
| Midterm results | Early calls pointed to Democratic gains 4 | Weighed, through lower spending expectations 3 |
| Treasury yields | US 10-year down 4 bps to 4.919% in early Asia trade 3 | Weighed |
| Oil and diplomacy | Brent near $103.85 after a four-week low 3 | Weighed on safe-haven demand 2 |
The data for the table above is referenced from CME FedWatch via FXStreet, Reuters, and Trading Economics, as of 4 November 2026.
The basket explains where the pressure landed. The euro carries a 57.6% weight in the DXY dollar index basket, the yen 13.6%, and sterling 11.9%, according to ICE. 8 In early Asia trade, EURUSD firmed 0.2% to 1.1212 and the yen strengthened to 158.30 per dollar. 3 If the euro sneezes, the dollar index catches the cold.
Then there is gold, usually the dollar’s mirror image. FXStreet reported bullion holding below $3,950 in the Asia session as Fed hike bets offset the softer dollar. 9 For anyone tracking the gold dollar index relationship, that is the cross-asset tell: the same rate pricing that failed to hold up the dollar was still capping gold. More handshake than seesaw, for now.
That leaves the practical question: which levels carry the most information today, and which dates could change the read?
Dollar Index Levels and Dates to Watch
These US dollar index DXY levels come straight from the USDX chart. They mark where the index traded or where its averages sat at the cut-off, not where it goes next. This is not a dollar index forecast, just a map of what the chart has already shown. Dollar index futures on ICE track the same basket, 8 so these zones tend to line up across the index trading and forex screens traders keep open.
USDX Levels Traders Are Watching, as of 10:24 (GMT+8) on 4 November 2026
| Level | Value | What It Marks on the Hourly Chart |
|---|---|---|
| Level 3 resistance | 102.32 | 28 October high, the top of the visible window |
| Level 2 resistance | 101.735 | 200-period moving average |
| Level 1 resistance | 101.622 | 50-period moving average |
| Gap zone | 101.53 to 101.70 | Space between the 3 November close and the 4 November reopening |
| Level 1 support | 101.26 | 2 November low, the floor that gave way |
| Level 2 support | 101.10 | 4 November intraday low |
The data for the table above is read from the Vantage USDX hourly chart on TradingView, as of 10:24 (GMT+8) on 4 November 2026. Values are approximate except the moving averages, taken from the chart legend.
Dollar Index Checklist for the Week
- US Midterm Calls, 4 November: Control of Congress was still hours from a definitive answer in Reuters’ early Asia report, 3 so more race calls land in Asian and European trading hours.
- Bank of England Decision, 5 November: A rate rise is widely expected, 3 and sterling makes up 11.9% of the basket. 8
- Fed Decision, 8 to 9 December: The next FOMC meeting comes with fresh economic projections, 10 with hike odds at 79% on 3 November. 1
- Brent and Middle East Diplomacy, Ongoing: Brent sat near $103.85 in early Asia trade; 3 Kong flagged that an escalation could lift oil and support the dollar. 3
What would change the read? It holds while the index stays below both averages and hike odds stay high. It weakens if the index recovers through the 101.62 to 101.74 band while those odds hold, which would suggest rate pricing is back in charge. For the backstory on how yields set up this week, our previous dollar index analysis covers the 28 to 30 October slide.
The morning opened on a contradiction: a Fed priced for a December rise and a dollar index that fell anyway. As of 10:24 (GMT+8), the chart’s answer is that rate pricing had been fading for a week; the vote count simply arrived when the index was already leaning lower.
Election-week sessions can produce price gaps like the one at the 4 November reopening, and a Stop Loss order may be filled at a worse level than the one set when prices gap. A Stop Loss limits losses to a planned size in normal conditions but does not guarantee the chosen price. Holding dollar index positions alongside EURUSD or USDJPY can also concentrate exposure, since the euro and yen together make up 71.2% of the basket. 8
Trading the dollar index on margin is leveraged, and leverage is double-edged: it magnifies losses as well as potential returns relative to the margin used. At an illustrative leverage of 1:100, the roughly 0.42% hourly range seen this morning equals about a 42% change relative to the margin on that position. Sizing positions as a percentage of account equity shows how much a single gap could affect the account balance.
Dollar Index FAQ
What Is the Dollar Index?
The US dollar index, also called the DXY index, the dollar index USDX, or simply the USDX index, measures the US dollar against six major currencies and is published by ICE. 8 The euro carries the largest weight at 57.6%, so EURUSD tends to dominate its moves. Our academy guide on what the dollar index is covers the full basket.
Is This a Dollar Index Forecast or DXY Prediction?
No. This dollar index analysis describes what the price, the averages, and the news flow have already shown, as of the cut-off time. Any DXY forecast carries uncertainty that no chart can remove, and nothing here should be read as a dollar index prediction.
How Are Gold and the Dollar Index Related?
Gold is priced in US dollars, so the two often move in opposite directions. On 4 November the link looked looser than usual, as bullion held below $3,950 while Fed hike bets offset the softer dollar. 9
RISK WARNING: CFDs are complex financial instruments and carry a high risk of losing money rapidly due to leverage. You should ensure you fully understand the risks involved and carefully consider whether you can afford to take the high risk of losing your money before trading.
Disclaimer: The information is provided for educational purposes only and doesn’t take into account your personal objectives, financial circumstances, or needs. It does not constitute investment advice. We encourage you to seek independent advice if necessary. The information has not been prepared in accordance with legal requirements designed to promote the independence of investment research. No representation or warranty is given as to the accuracy or completeness of any information contained within. This material may contain historical or past performance figures and should not be relied on. Furthermore estimates, forward-looking statements, and forecasts cannot be guaranteed. The information on this site and the products and services offered are not intended for distribution to any person in any country or jurisdiction where such distribution or use would be contrary to local law or regulation.
References
- “Gold falls near $3,900 amid rising US yields and Fed hawkish bets – FXStreet” https://fxstreet.com/news/gold-falls-near-3-900-amid-rising-us-yields-and-fed-hawkish-bets-202611031909 Accessed on 4 November 2026.
- “United States Dollar – Trading Economics” https://tradingeconomics.com/united-states/currency Accessed on 4 November 2026.
- “Dollar dips with US midterm results in focus – Reuters via Investing.com” https://www.investing.com/news/economy-news/dollar-dips-with-us-midterm-results-in-focus-4997104 Accessed on 4 November 2026.
- “US Dollar falls below 101.50 as early midterm results point to Democratic gains – FXStreet” https://www.fxstreet.com/news/breaking-us-dollar-falls-below-10150-as-early-midterm-results-point-to-democratic-gains-202611040146 Accessed on 4 November 2026.
- “Federal Reserve issues FOMC statement – Board of Governors of the Federal Reserve System” https://www.federalreserve.gov/newsevents/pressreleases/monetary20261028a.htm Accessed on 4 November 2026.
- “Dollar Index Hits 4-week Low – Trading Economics” https://tradingeconomics.com/united-states/currency/news/597233 Accessed on 4 November 2026.
- “Weaker dollar views stick running into US midterms, but strategists brace for resilience: Reuters poll – Reuters via Investing.com” https://www.investing.com/news/economy-news/weaker-dollar-views-stick-running-into-us-midterms-but-strategists-brace-for-resilience-reuters-poll-4994618 Accessed on 4 November 2026.
- “ICE USDX Brochure – Intercontinental Exchange” https://www.ice.com/publicdocs/ICE_USDX_Brochure.pdf Accessed on 4 November 2026.
- “Euro rises to near 1.1250, US midterm elections in spotlight – FXStreet” https://www.fxstreet.com/news/euro-rises-to-near-11250-us-midterm-elections-in-spotlight-202611040126 Accessed on 4 November 2026.
- “Meeting calendars and information – Board of Governors of the Federal Reserve System” https://www.federalreserve.gov/monetarypolicy/fomccalendars.htm Accessed on 4 November 2026.
Key Points In This Article

Latest Financial Market Analysis


Market Analysis Tags
- # USD News
- # USDCAD News
- # USDJPY News
- # USDX News
- # Forex News
- # Forex News Today
- # GBPUSD News
- # EURUSD News
- # Currency Trading News
- # AUDUSD news
Related Articles
- The Pound Dragged By Hot US Inflation Reviving Fed Hike Bets – GBPUSD Analysis
- Why the Canadian Dollar Fell as US Inflation Widened the Rate Gap – USDCAD Analysis
- S&P 500 Recovered as Hot CPI Lifted Fed Hike Bets – SP500 Analysis
- Dollar Yen Climbed as Hot US CPI Outran a Hawkish BoJ – USDJPY Analysis
- Gold On a Roller Coaster Ride Alongside Wall Street Before Payrolls – XAUUSD Analysis
- Why AppLovin Stock Rose 31% as Q3 Earnings Cleared Its Own Guidance – APP Analysis
- Brent Crude Oil Price Pressured as Midterms Lifted Iran Peace Bets – UKOUSD and USOUSD Analysis
- McDonald’s Stock Rose as Q3 Earnings Beat Outweighed a US Sales Dip – MCD Analysis