Important Information
You are visiting the international Vantage Markets website, distinct from the website operated by Vantage Global Prime LLP
( www.vantagemarkets.co.uk ) which is regulated by the Financial Conduct Authority ("FCA").
This website is managed by Vantage Markets' international entities, and it's important to emphasise that they are not subject to regulation by the FCA in the UK. Therefore, you must understand that you will not have the FCA’s protection when investing through this website – for example:
- You will not be guaranteed Negative Balance Protection
- You will not be protected by FCA’s leverage restrictions
- You will not have the right to settle disputes via the Financial Ombudsman Service (FOS)
- You will not be protected by Financial Services Compensation Scheme (FSCS)
- Any monies deposited will not be afforded the protection required under the FCA Client Assets Sourcebook. The level of protection for your funds will be determined by the regulations of the relevant local regulator.
If you would like to proceed and visit this website, you acknowledge and confirm the following:
- 1.The website is owned by Vantage Markets' international entities and not by Vantage Global Prime LLP, which is regulated by the FCA.
- 2.Vantage Global Limited, or any of the Vantage Markets international entities, are neither based in the UK nor licensed by the FCA.
- 3.You are accessing the website at your own initiative and have not been solicited by Vantage Global Limited in any way.
- 4.Investing through this website does not grant you the protections provided by the FCA.
- 5.Should you choose to invest through this website or with any of the international Vantage Markets entities, you will be subject to the rules and regulations of the relevant international regulatory authorities, not the FCA.
Vantage wants to make it clear that we are duly licensed and authorised to offer the services and financial derivative products listed on our website. Individuals accessing this website and registering a trading account do so entirely of their own volition and without prior solicitation.
By confirming your decision to proceed with entering the website, you hereby affirm that this decision was solely initiated by you, and no solicitation has been made by any Vantage entity.
I confirm my intention to proceed and enter this website Please direct me to the website operated by Vantage Global Prime LLP regulated by the FCA in the United KingdomImportant Information
By providing your email and proceeding to create an account on this website, you acknowledge that you will be opening an account with Vantage Global Limited, regulated by the Vanuatu Financial Services Commission (VFSC), and not the UK Financial Conduct Authority (FCA).
-
Please enter a valid email address
-
Please tick the checkbox to proceed
-
Please tick the checkbox to proceed
Please tick all to proceed

Access Restricted
Your access to this website is restricted.
Our website and services are not available to, and are not intended for, individuals who are citizens or residents of the United States, or entities incorporated in or conducting business within the United States.
If this does not apply to you and you believe you have received this message in error, please contact us at support@vantagemarkets.com for further assistance.
If you fall into any of the above categories, please exit the site.
Important Information
Thank you for visiting the Vantage Markets website. Please note that this website is intended for individuals residing in jurisdictions where accessing it is permitted by Vantage and its affiliated entities do not operate in your home jurisdiction.
By clicking 'I CONFIRM MY INTENTION TO PROCEED AND ENTER THIS WEBSITE', you confirm that you are entering this website solely based on your initiative and not as a result of any specific marketing outreach. You wish to obtain information from this website based on reverse solicitation principles, in accordance with the applicable laws of your home jurisdiction.
I CONFIRM MY INTENTION TO PROCEED AND ENTER THIS WEBSITE
-

-


Download App
-


-

-

-
Search query too short. Please enter a full word or phrase.
-

Keywords
Popular Search








Language

 Market Analysis Commodities Why Crude Oil Prices Rose as Iran Strike Reports Lifted Brent: UKOUSD and USOUSD Analysis
Why Crude Oil Prices Rose as Iran Strike Reports Lifted Brent: UKOUSD and USOUSD Analysis

Vantage Editorial Team >
23 October 2026 | Commodities | 16 min read
Vantage Editorial Team >
Vantage is a global, multi-asset broker with a team of experienced in-house writers, analysts, and market professionals. Together, they craft trusted, educational, and market-driven content tailored for traders at every stage—from beginner to pro.
- Brent (UKOUSD) traded at 111.12 and WTI (USOUSD) at 99.06 on the Vantage feed as of 01:48 (UTC) / 09:48 (GMT+8) on 22 October 2026, a gap of $12.06 a barrel.
- US commercial crude inventories fell 3.1 million barrels in the week to 16 October, to 412.5 million barrels. 1
- On the hourly chart, Brent sat just above its 50-period moving average at the cut-off, while WTI sat below its own.
Brent crude traded at $111.12 a barrel on Thursday morning, $12.06 above WTI, in a week when US inventory data leaned in the American grade’s favour. As of 01:48 (UTC) / 09:48 (GMT+8) on 22 October 2026, UKOUSD stood at 111.12 and USOUSD at 99.06 on the Vantage feed, hours after the Energy Information Administration (EIA) reported a 3.1 million-barrel drop in US commercial crude stocks. 1
We like a tidy story, and this week’s crude oil news did not offer one. Reports of planned US and Israeli strikes on Iran lifted crude oil prices across the board, 2 yet no single crude oil price told the whole story: Brent kept more of the move. This piece unpacks why, and what a $12 gap changes for anyone watching both benchmarks into next week’s EIA data and Federal Reserve decision.
Instrument Snapshot: As of 01:48 (UTC) / 09:48 (GMT+8) on 22 October 2026, UKOUSD traded about 1.99% above its 21 October low near 108.95, and USOUSD about 1.81% above its low near 97.30. On the crude oil futures price side, crude oil WTI futures carried a 52-week range of 54.98 to 117.63. 3
Crude Oil Prices Today: The Quick Answer
Crude oil prices rose on 22 October as reports of planned US and Israeli strikes on Iran lifted both benchmarks. Brent traded at $111.12, $12.06 above WTI at $99.06, even though US crude stocks fell 3.1 million barrels, suggesting markets priced shipping risk the most.
Table 1: Today’s Crude Oil Rate, Brent vs WTI at a Glance (01:48 (UTC) / 09:48 (GMT+8) on 22 October 2026)
| Measure | Brent (UKOUSD) | WTI (USOUSD) |
| Price at Cut-Off | 111.12 | 99.06 |
| Position vs Hourly 50-Period Average | Just Above (111.04) | Below (99.46) |
| Hourly 200-Period Average | 109.01 | 96.33 |
| RSI (14) | 52.63 | 49.99 |
| Week Range, 15 to 20 October | 105.90 to 113.40 (7.08%) | 93.60 to 102.30 (9.29%) |
| Where the Price Is Set | Waterborne Delivery (Seaborne) | Cushing, Oklahoma (Inland Hub) |
Prices and indicators from the Vantage feed on TradingView hourly charts, accessed on 22 October 2026; pricing points per OilPrice.com and Rigzone. 10,11 Data indicative, for informational purposes only.
Strike Reports Lifted Both Benchmarks
Brent crude futures rose 1.71% to $110.67 and WTI crude oil gained 1.42% to $98.53 on Thursday, CNBC reported, as the New York Times said the US and Israeli militaries had drawn up plans for renewed strikes on Iran after the 3 November midterm elections. 2 Vantage has not independently verified the Times report. Our Iran news coverage tracks how that thread develops.
On 20 October, Brent touched a five-month high and WTI a six-month peak before both fell back on reports of mediation talks in Tehran. 4 Iran’s foreign minister, Abbas Araghchi, said Tehran would keep its restrictions on the Strait of Hormuz until Washington accepts its terms. 5 A drone attack on Saudi Aramco’s Shaybah oil field killed two people, 6 and the US ordered non-emergency staff out of Saudi Arabia. 7
Analysts at oil brokerage PVM noted that neither the Middle East nor the Russia-Ukraine conflict “has shown any signs of de-escalation”. 4 The flow data is less one-sided: Kpler figures showed Middle East oil moving through Hormuz back near pre-war levels, 7 a point US Secretary of State Marco Rubio also made. 6
Both benchmarks had the same headlines to work with. They spent them differently.
Brent Reclaimed Its 50-Period Average
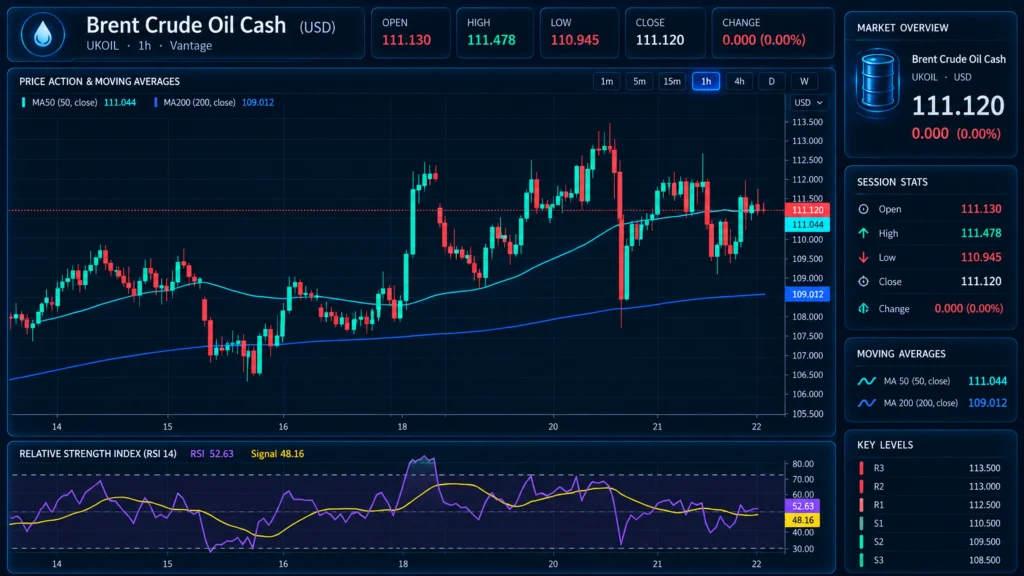
The Brent crude oil price spent the week between roughly 105.90 on 15 October and 113.40 on 20 October, a range of about $7.50. The climb picked up on 16 October, when Brent crude oil futures gained 3.72%. 8 The 20 October high did not last: as the mediation reports surfaced, UKOUSD dropped about $6.00 to near 107.40 within a few hourly bars.
The more telling move came a day later. The 21 October dip stopped near 108.95, within cents of the 200-period moving average (109.01 at the cut-off), and the price climbed back to 111.12, just above the 50-period average at 111.04. Our Brent crude oil news feed follows the Brent crude story as it develops.
The Relative Strength Index (RSI, 14) on the TradingView setup used for this analysis read 52.63, above its own moving average at 48.16. It dipped below 30 on 15 October, topped 70 on 16 October, and fell near 33 on 20 October, so it has done the full tour this week and is now parked in the middle.
WTI got the same headlines and the same dip. Its recovery stopped short of its own 50-period average.
WTI Lagged Despite US Stock Draws
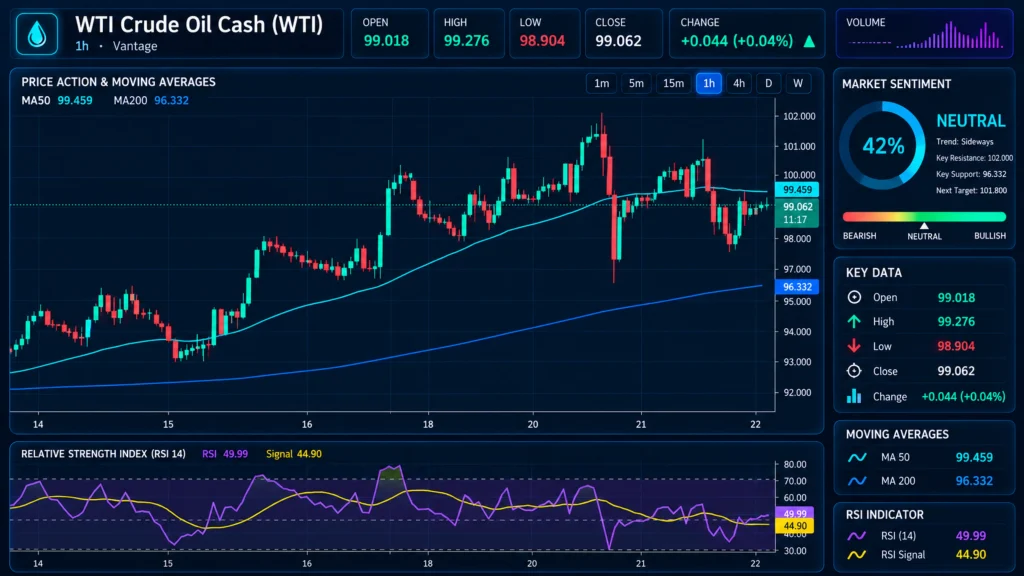
The WTI crude oil price swung harder but finished softer. USOUSD ranged from near 93.60 on 15 October to near 102.30 on 20 October, about 9.29% against Brent’s 7.08%, and its 20 October drop ran about 5.96% to near 96.20.
At the cut-off, the current WTI crude oil price on the Vantage feed was 99.06, below a 50-period average that had flattened at 99.46. On an hourly chart, a flat average is about as close as an indicator gets to a shrug. RSI read 49.99, against its moving average at 44.90. Our WTI crude oil news page follows the US benchmark day to day.
The national data should have helped: the EIA also reported an 8.5 million-barrel fall in total commercial petroleum inventories, with commercial crude about 3% below its five-year average. 1,9
One detail points closer to an answer. The American Petroleum Institute (API) estimated that stocks at Cushing, Oklahoma, the hub where WTI is priced, rose 900,000 barrels that week, after about 1.82 million the week before. 10 Cushing is a town far better known to oil traders than to most map readers, and its storage was filling while national stocks fell.
So if US barrels were getting scarcer overall, why did the US benchmark trail? The answer is in how each price gets delivered.
A $12 Gap Priced on the Route
Brent is priced on waterborne delivery, so shipping premiums feed straight into it, while WTI is priced at an inland, pipeline-fed hub. 11 Think of the spread as a toll on the sea route: the more risk attached to tankers, the more Brent crude oil prices have tended to charge over a barrel sitting in Oklahoma. Our guide to trading oil covers how the two benchmarks differ.
The toll has stayed high for weeks. At the end of September, Standard Chartered’s head of energy research, Emily Ashford, said WTI’s discount to Brent had deepened past $12, “its widest since early May”. 11 Subtracting USOUSD from UKOUSD, we measured about $11.10 at the 20 October highs, which printed within about an hour of each other, and $12.06 at the cut-off. Thursday’s futures quotes tell the same story: $110.67 for Brent against $98.53 for WTI, a $12.14 gap. 2 Not glamorous arithmetic, but probably the most useful sum on this page.
US crude stocks fell, Cushing filled, and Brent held its $12 lead over WTI.
Here is the part that surprised us. On Kpler’s numbers, flows through Hormuz are back near pre-war levels, 7 yet Brent still carries the wider premium. That suggests markets are pricing the risk to the route, the attacks and the shipping premiums, more than the volume moving along it.
Demand adds a second layer. Kpler senior crude oil analyst Muyu Xu said “China’s crude import demand is expected to continue recovering”. 7 If that holds, it points to firmer demand for seaborne crude, the side of the market Brent is more exposed to.
The read would weaken if the spread narrowed sharply while the headlines stayed the same, and strengthen if the gap widened on shipping news alone. That leaves a short list of levels and dates where it gets tested.
Levels and Dates Traders Are Watching

Table 2: UKOUSD and USOUSD Hourly Levels (01:48 (UTC) / 09:48 (GMT+8) on 22 October 2026)
| Level | UKOUSD (Brent) | USOUSD (WTI) |
| Week High, 20 October | Near 113.40 | Near 102.30 |
| Hourly 50-Period Moving Average | 111.04 | 99.46 |
| Price at Cut-Off | 111.12 | 99.06 |
| Hourly 200-Period Moving Average | 109.01 | 96.33 |
| 21 October Low | Near 108.95 | Near 97.30 |
| Week Low, 15 October | Near 105.90 | Near 93.60 |
Levels read from the Vantage feed on TradingView hourly charts, accessed on 22 October 2026. Data indicative, for informational purposes only.
- EIA Weekly Petroleum Status Report, 28 October 2026: Released at 14:30 (UTC) / 22:30 (GMT+8), with the next read on US crude, gasoline, and Cushing stocks, and the next test for the WTI crude price. 12
- Federal Reserve Decision, 28 October 2026: The statement is due at 18:00 (UTC), which is 02:00 (GMT+8) on 29 October. 13
- US Midterm Elections, 3 November 2026: The date the New York Times report tied to possible renewed strikes. 2
- Hormuz Flow Data, Weekly: Whether tanker tallies stay near pre-war levels; we log each update in oil price news today and wider commodities news.
So why did Brent hold the firmer chart in a week of US stock draws? On the evidence so far, the route. While the spread holds near $12, today’s crude oil prices can answer one headline with moves of different sizes in Brent and the WTI oil price. A narrowing toward single digits would be the clearest sign that the read no longer holds. Updates run in crude oil news today.
Headlines have repeatedly moved oil within hours this month, and the roughly $6.00 drop in UKOUSD on 20 October showed how quickly oil prices can move through nearby levels. A Stop Loss can limit losses to a planned size, although it cannot guarantee execution at that exact price when markets gap. Holding positions in both Brent and WTI also concentrates exposure on one set of headlines.
Leverage is double-edged: it magnifies gains and losses alike on oil positions, which matters more in a week when Brent’s range ran to about $7.50. Sizing positions as a proportion of account equity, with the risk on any single position kept to a small, fixed percentage, can stop one headline from carrying outsized weight in an account.
Crude Oil Prices: Common Questions
What Is the Brent Crude Oil Price Today?
As of 01:48 (UTC) / 09:48 (GMT+8) on 22 October 2026, UKOUSD traded at 111.12 on the Vantage feed, the Brent oil price today in snapshot form. Brent crude futures were reported at $110.67 on Thursday. 2
Is This the Crude Oil Price Now?
No, these are snapshot figures. A live crude oil price ticker shows the Brent crude oil price live and the WTI crude oil price live as they move on from these figures. At the cut-off, the Brent crude price in USD was 111.12 and WTI was 99.06.
Why Is WTI Cheaper Than Brent?
WTI is priced at Cushing, an inland pipeline hub, while Brent is priced on waterborne delivery, so shipping risk feeds into Brent more directly. 11 The gap was $12.06 at the cut-off.
What Moved Crude Oil Prices This Week?
Strike reports, attacks on Saudi energy sites, mediation headlines, and lower US crude stocks all coincided with the moves. 1,2,4,6
RISK WARNING: CFDs are complex financial instruments and carry a high risk of losing money rapidly due to leverage. You should ensure you fully understand the risks involved and carefully consider whether you can afford to take the high risk of losing your money before trading.
Disclaimer: The information is provided for educational purposes only and doesn’t take into account your personal objectives, financial circumstances, or needs. It does not constitute investment advice. We encourage you to seek independent advice if necessary. The information has not been prepared in accordance with legal requirements designed to promote the independence of investment research. No representation or warranty is given as to the accuracy or completeness of any information contained within. This material may contain historical or past performance figures and should not be relied on. Furthermore estimates, forward-looking statements, and forecasts cannot be guaranteed. The information on this site and the products and services offered are not intended for distribution to any person in any country or jurisdiction where such distribution or use would be contrary to local law or regulation.
References
[1] “Weekly Petroleum Status Report, 21 October 2026 – U.S. Energy Information Administration” https://www.eia.gov/petroleum/supply/weekly/archive/2026/2026_10_21/wpsr_2026_10_21.php Accessed on 22 October 2026.
[2] “Oil prices jump on Middle East worries as U.S., Israel reportedly weigh fresh Iran strikes – CNBC” https://www.cnbc.com/2026/10/22/oil-prices-today-wti-brent-saudi-arabia.html Accessed on 22 October 2026.
[3] “Crude Oil WTI Futures Historical Prices – Investing.com” https://www.investing.com/commodities/crude-oil-historical-data Accessed on 22 October 2026.
[4] “Oil prices jump $2 as Iran knocks hopes of diplomatic progress – Business Recorder” https://www.brecorder.com/news/40445237/oil-prices-jump-2-as-iran-knocks-hopes-of-diplomatic-progress Accessed on 22 October 2026.
[5] “Iran clings to demands even as threat of renewed US-Israel attacks grows – The National” https://www.thenationalnews.com/news/gulf/2026/10/21/araghchi-says-strait-of-hormuz-will-stay-closed-until-us-agrees-to-irans-terms/ Accessed on 22 October 2026.
[6] “Brent oil – Price – Chart – Historical Data – News – Trading Economics” https://tradingeconomics.com/commodity/brent-crude-oil Accessed on 22 October 2026.
[7] “U.S. pulls diplomats from Saudi Arabia as it reportedly readies Iran strikes after midterms – CNBC” https://www.cnbc.com/2026/10/22/us-iran-trump-hormuz-.html Accessed on 22 October 2026.
[8] “Brent Oil Futures Historical Prices – Investing.com” https://www.investing.com/commodities/brent-oil-historical-data Accessed on 22 October 2026.
[9] “EIA: US crude oil inventories down 3.1 million bbl – Oil & Gas Journal” https://www.ogj.com/general-interest/economics-markets/news/55413538/eia-us-crude-oil-inventories-down-31-million-bbl Accessed on 22 October 2026.
[10] “API: Crude, Product Inventories Continue to Draw – OilPrice.com” https://oilprice.com/Latest-Energy-News/World-News/API-Crude-Products-Continu-eto-Draw.html Accessed on 22 October 2026.
[11] “Analysts Look at WTI-Brent Spread – Rigzone” https://www.rigzone.com/news/analysts_look_at_wtibrent_spread-01-oct-2026-184747-article/ Accessed on 22 October 2026.
[12] “Weekly Petroleum Status Report Schedule – U.S. Energy Information Administration” https://www.eia.gov/petroleum/supply/weekly/schedule.php Accessed on 22 October 2026.
[13] “October 2026 – Board of Governors of the Federal Reserve System” https://www.federalreserve.gov/newsevents/2026-october.htm Accessed on 22 October 2026.
Key Points In This Article

Latest Financial Market Analysis


Market Analysis Tags
- # USD News
- # USDCAD News
- # USDJPY News
- # USDX News
- # Forex News
- # Forex News Today
- # GBPUSD News
- # EURUSD News
- # Currency Trading News
- # AUDUSD news
Related Articles
- Why Meta Stock Rose After Hours as Q3 Revenue Beat and Class C Split Plan Landed – META Analysis
- Micron Stock Steadies After China-Led Memory Slide: What It Means for MU Traders
- Why Silver Fell as Oil Lifted Fed Hike Bets – XAGUSD Analysis
- Why the Dow Jones Rose as Healthcare Lifted Blue Chips – DJ30 Analysis
- Why the US Dollar Index Slipped as the Euro and Yen Firmed – USDX Analysis
- Tesla Stock Price Today: Q3 Earnings and SpaceX Merger Talk, and What It Means for TSLA Traders
- Why the S&P 500 Climbed as AI Stocks Rebounded – SP500 Analysis
- Why the US Dollar Index Slipped as Fed Hike Bets Faded – USDX Analysis