Important Information
You are visiting the international Vantage Markets website, distinct from the website operated by Vantage Global Prime LLP
( www.vantagemarkets.co.uk ) which is regulated by the Financial Conduct Authority ("FCA").
This website is managed by Vantage Markets' international entities, and it's important to emphasise that they are not subject to regulation by the FCA in the UK. Therefore, you must understand that you will not have the FCA’s protection when investing through this website – for example:
- You will not be guaranteed Negative Balance Protection
- You will not be protected by FCA’s leverage restrictions
- You will not have the right to settle disputes via the Financial Ombudsman Service (FOS)
- You will not be protected by Financial Services Compensation Scheme (FSCS)
- Any monies deposited will not be afforded the protection required under the FCA Client Assets Sourcebook. The level of protection for your funds will be determined by the regulations of the relevant local regulator.
If you would like to proceed and visit this website, you acknowledge and confirm the following:
- 1.The website is owned by Vantage Markets' international entities and not by Vantage Global Prime LLP, which is regulated by the FCA.
- 2.Vantage Global Limited, or any of the Vantage Markets international entities, are neither based in the UK nor licensed by the FCA.
- 3.You are accessing the website at your own initiative and have not been solicited by Vantage Global Limited in any way.
- 4.Investing through this website does not grant you the protections provided by the FCA.
- 5.Should you choose to invest through this website or with any of the international Vantage Markets entities, you will be subject to the rules and regulations of the relevant international regulatory authorities, not the FCA.
Vantage wants to make it clear that we are duly licensed and authorised to offer the services and financial derivative products listed on our website. Individuals accessing this website and registering a trading account do so entirely of their own volition and without prior solicitation.
By confirming your decision to proceed with entering the website, you hereby affirm that this decision was solely initiated by you, and no solicitation has been made by any Vantage entity.
I confirm my intention to proceed and enter this website Please direct me to the website operated by Vantage Global Prime LLP regulated by the FCA in the United KingdomImportant Information
By providing your email and proceeding to create an account on this website, you acknowledge that you will be opening an account with Vantage Global Limited, regulated by the Vanuatu Financial Services Commission (VFSC), and not the UK Financial Conduct Authority (FCA).
-
Please enter a valid email address
-
Please tick the checkbox to proceed
-
Please tick the checkbox to proceed
Please tick all to proceed

Access Restricted
Your access to this website is restricted.
Our website and services are not available to, and are not intended for, individuals who are citizens or residents of the United States, or entities incorporated in or conducting business within the United States.
If this does not apply to you and you believe you have received this message in error, please contact us at support@vantagemarkets.com for further assistance.
If you fall into any of the above categories, please exit the site.
Important Information
Thank you for visiting the Vantage Markets website. Please note that this website is intended for individuals residing in jurisdictions where accessing it is permitted by Vantage and its affiliated entities do not operate in your home jurisdiction.
By clicking 'I CONFIRM MY INTENTION TO PROCEED AND ENTER THIS WEBSITE', you confirm that you are entering this website solely based on your initiative and not as a result of any specific marketing outreach. You wish to obtain information from this website based on reverse solicitation principles, in accordance with the applicable laws of your home jurisdiction.
I CONFIRM MY INTENTION TO PROCEED AND ENTER THIS WEBSITE
-

-


Download App
-


-

-

-
Search query too short. Please enter a full word or phrase.
-

Keywords
Popular Search








Language


20 Chart Patterns: How They Form and How to Read Them

Vantage Editorial Team >
18 November 2026 | Academy | 49 min read
Vantage Editorial Team >
Vantage is a global, multi-asset broker with a team of experienced in-house writers, analysts, and market professionals. Together, they craft trusted, educational, and market-driven content tailored for traders at every stage—from beginner to pro.

Chart patterns are recurring shapes that form on a price chart — such as Head and Shoulders, Double Tops, and Triangles — created when buyers and sellers repeatedly push price toward the same levels of support and resistance. The shapes are often read as a record of how buyers and sellers behaved at key price levels.
Some chart patterns are read as signs that a trend may continue, others as signs that a reversal may be forming, and a smaller group as a sign of rising uncertainty. The same shapes, such as the Double Top or Ascending Triangle, appear on forex, stock, index, and commodity charts, which is often attributed to buyers and sellers competing at the same price levels. This guide covers 20 of these formations, including how each one tends to form, where it can fail, and a hypothetical example of each.
This article is provided for general educational purposes only and should not be regarded as investment advice, a recommendation, or a solicitation to trade any financial instrument.
Key Points
- Chart patterns are visual formations that reflect shifts in market psychology between buyers and sellers, falling broadly into continuation, reversal, and bilateral categories.
- The 20 patterns covered here — including Head and Shoulders, the wedges, the flags, and the triangle formations — appear across forex, stocks, indices, and commodities, which is often attributed to repeated trading behaviour rather than features of any one asset.
- Traders who use chart patterns typically wait for confirmation, combine them with other technical indicators, and apply consistent risk management, since no pattern guarantees a specific outcome.
What Are Chart Patterns in Trading?
Chart patterns are recognisable shapes that emerge when price movements are plotted on a chart — whether a candlestick chart, line, or bar chart. They act as visual footprints of market psychology, showing how buyers and sellers interact at critical levels of support and resistance.
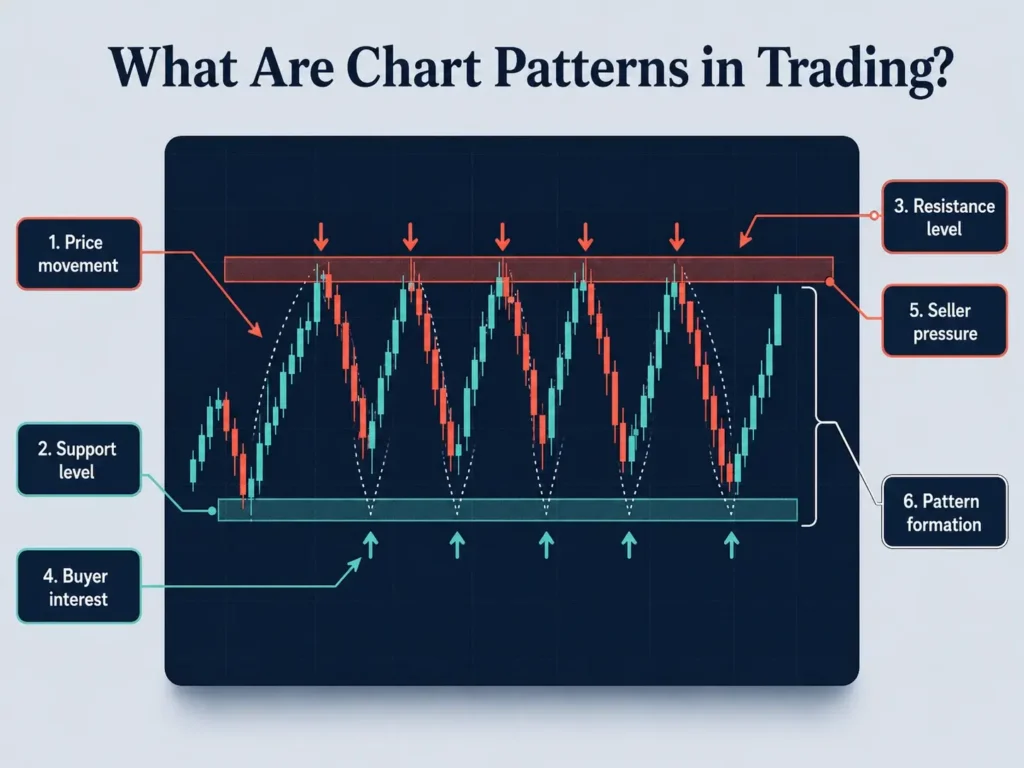
By studying these formations, traders may use them to help interpret whether the market could continue in its current direction or shift course altogether. Patterns that emerge during a sustained decline — sometimes referred to broadly as downtrend chart patterns — include the Descending Triangle, the Bear Flag, and the bearish versions of the Head and Shoulders and Double Top, all covered below.
Chart patterns fall into three broad categories:
- Continuation Patterns: These are interpreted as pauses in an existing trend, which some traders view as potential signs the trend may continue. Examples include rectangles, triangles, flags, cup-and-handle, and pennants — usually a consolidation phase where some traders take profits while others enter before the trend resumes.
- Reversal Patterns: These are interpreted by traders as potential signs that a prevailing trend could be weakening and may reverse — a bullish trend turning bearish, or vice versa. Head and Shoulders, Double Tops, and Double Bottoms are common examples, often forming after a prolonged move in one direction.
- Bilateral Patterns: These suggest the market could break in either direction, reflecting genuine uncertainty rather than a clear lean toward continuation or reversal. The Symmetrical Triangle and the Broadening Formation, both covered later in this guide, are examples.
The same formations turn up across forex, equities, indices, and commodities, markets that traders can speculate on through CFDs. This is often attributed to the human behaviour behind them, which can repeat.
A trader studying a candlestick chart might notice a double bottom forming in a stock index or a flag developing on a gold CFD chart. As with any branch of technical analysis, timeframe matters: traders often give patterns on daily or weekly charts more weight than those on intraday charts, where the same shapes can reflect short bursts of volatility.
Continuation, Reversal, and Bilateral Patterns at a Glance
Before working through each formation in depth, it helps to see how the 20 patterns relate to one another. Several are mirror opposites — an Ascending Triangle and a Descending Triangle, a Rising Wedge and a Falling Wedge, or a Head and Shoulders and its inverse — while the Symmetrical Triangle and the Broadening Formation can resolve in either direction depending on how price eventually breaks out. The table below groups all 20 by category and typical bias, alongside the signal commonly treated as confirmation.
| Pattern | Category | Typical Bias | Confirmation Signal |
| Head and Shoulders | Reversal | Bearish | Close below the neckline |
| Inverse Head and Shoulders | Reversal | Bullish | Close above the neckline |
| Double Top | Reversal | Bearish | Close below the support between the peaks |
| Double Bottom | Reversal | Bullish | Close above the resistance between the lows |
| Triple Top | Reversal | Bearish | Close below the lowest low between the peaks |
| Triple Bottom | Reversal | Bullish | Close above the highest high between the lows |
| Rising Wedge | Reversal or continuation | Bearish | Close below the lower trendline |
| Falling Wedge | Reversal or continuation | Bullish | Close above the upper trendline |
| Rounding Bottom | Reversal | Bullish | Close above the high where the pattern began |
| Diamond Top | Reversal | Bearish | Close below the lower boundary |
| Inverse Cup and Handle | Reversal | Bearish | Close below the rim of the cup |
| Ascending Triangle | Continuation | Bullish | Breakout above horizontal resistance |
| Descending Triangle | Continuation | Bearish | Breakdown below horizontal support |
| Bull Flag | Continuation | Bullish | Breakout above the flag |
| Bear Flag | Continuation | Bearish | Breakdown below the flag |
| Pennant | Continuation | Follows prior trend | Breakout in the direction of the prior move |
| Cup and Handle | Continuation | Bullish | Breakout above the rim of the cup |
| Rectangle | Continuation | Follows prior trend | Close beyond the top or bottom of the range |
| Symmetrical Triangle | Bilateral | Neutral | Breakout beyond either trendline |
| Broadening Formation | Bilateral | Neutral | Breakout beyond either trendline |
Free Chart Patterns Cheat Sheet (PDF): All 20 patterns, their categories, and their confirmation signals on three printable pages. No sign-up needed.
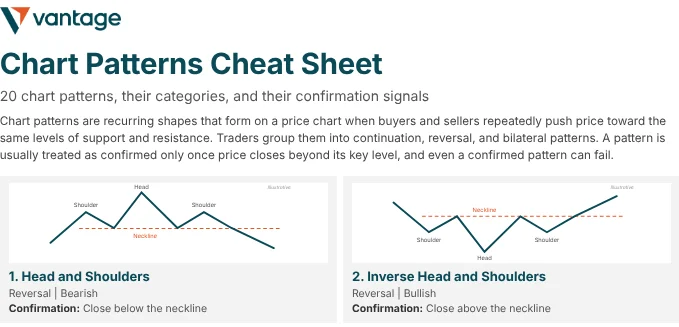
20 Chart Patterns Explained
The 20 types of chart patterns below are grouped into reversal, continuation, and bilateral patterns. Each one covers how the pattern forms, the level traders commonly treat as confirmation, and a hypothetical example of where a stop-loss and a measured-move projection or reference level could sit. The examples use round numbers on an unnamed instrument. These examples are hypothetical and for illustrative purposes only. They do not reflect actual trading results and leave out spreads and overnight swaps.
Reversal Patterns
Reversal patterns are read as signs that a trend may be losing momentum and could turn. The two wedges are included here, although each can also appear as a continuation pattern.
1. Head and Shoulders — Bearish Reversal
The Head and Shoulders pattern is a reversal pattern defined by three peaks. It usually forms at the top of an uptrend and is often read as a sign that buying momentum is fading.
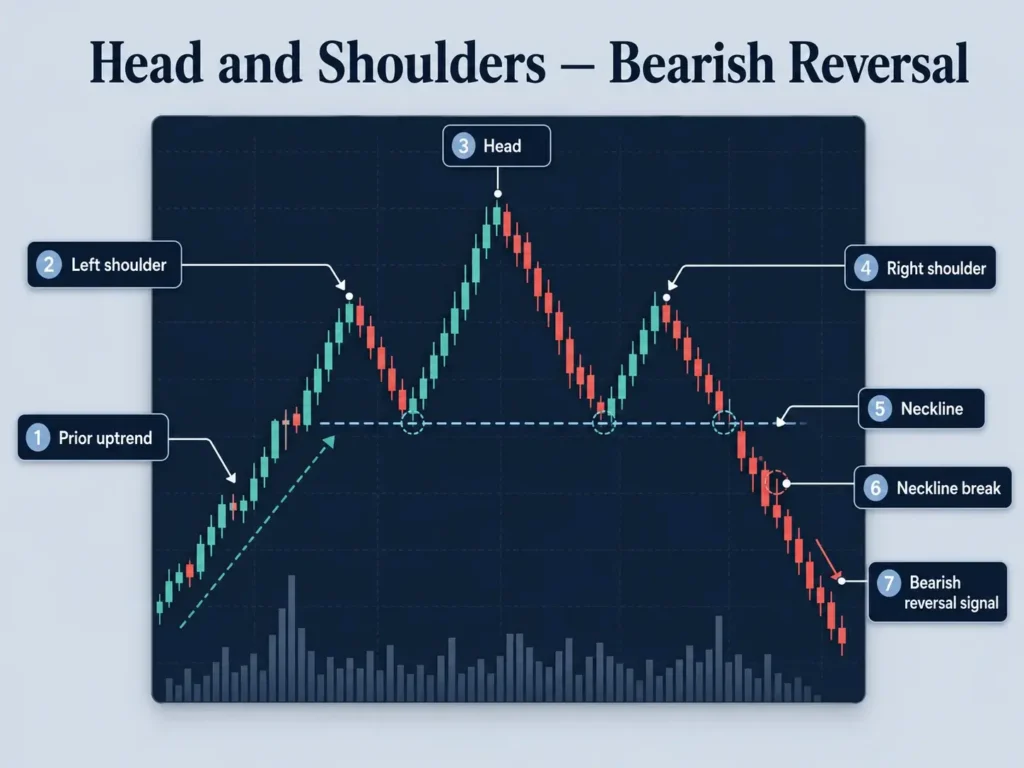
The pattern has three peaks: the left shoulder, the higher middle peak known as the head, and the right shoulder, which is typically similar in height to the left. The critical feature is the neckline, which connects the lows beneath the shoulders.
When price breaks below this neckline, traders may interpret it as a potential bearish reversal signal and monitor whether downside momentum develops. Traders often monitor this setup as a possible sign of a trend change after a long rally.
Key features:
- Three-peak structure, with the middle peak (the head) higher than both shoulders
- Neckline break below the shoulder lows is the standard confirmation signal
- Often analysed on daily or weekly charts, where the formation reflects weeks of trading activity
- Commonly seen at the end of an extended uptrend, across forex, indices, and individual stocks
Hypothetical Example: The neckline sits at 100, the head at 110, and the right shoulder at 105.
- Confirmation: A close below 100.
- Stop-Loss: Above the right shoulder, at 106. A stop-loss does not guarantee the exit price, particularly during gaps or fast markets.
- Measured-Move Projection: 90, which is the neckline minus the head’s height above it (110 − 100 = 10).1 Price may stop short of the projection or reverse.
2. Inverse Head and Shoulders — Bullish Reversal
The Inverse Head and Shoulders pattern is the mirror image of the classic Head and Shoulders pattern and signals a potential bullish reversal.
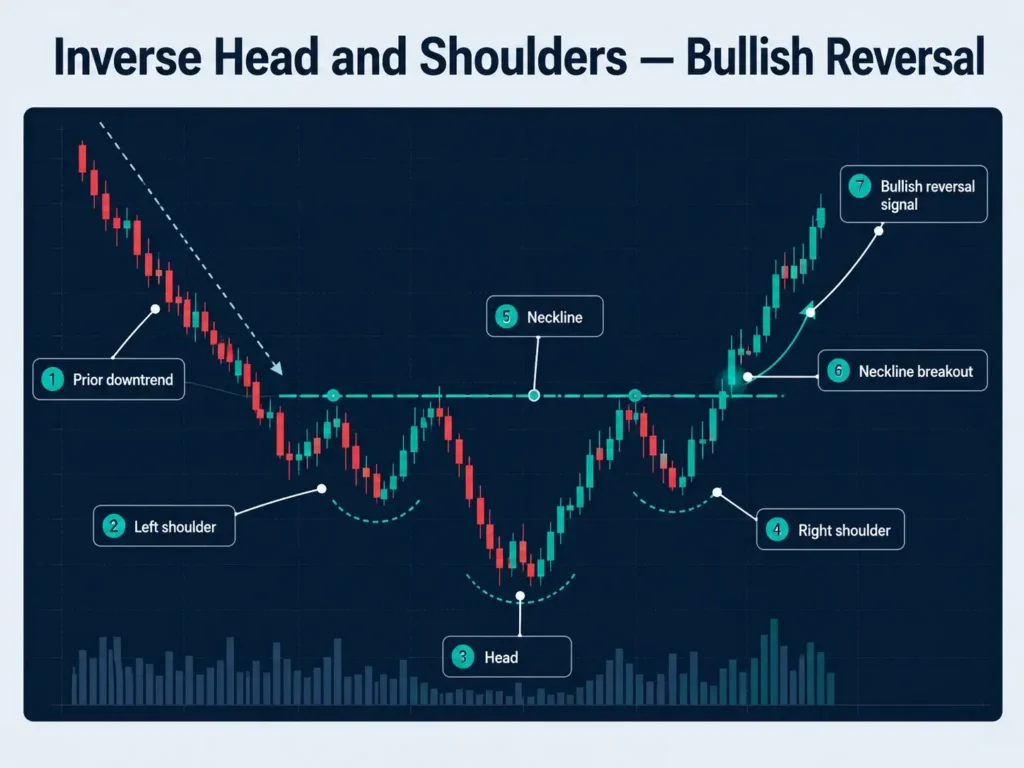
Instead of peaks, three troughs form: the middle trough (the head) is the lowest point, while the two side troughs (the shoulders) sit higher. The neckline connects the highs between the troughs.
A breakout above the neckline is often interpreted by traders as a potential shift from selling pressure to buying momentum, with some monitoring whether buying momentum strengthens once the breakout is confirmed by a rise in volume. This pattern often appears after a downtrend and is sometimes viewed as an indication of a potential bullish phase.
Key features:
- Three-trough structure, with the head forming the lowest point between two higher shoulders
- Neckline break above the shoulder highs is the standard confirmation signal
- Typically appears at the end of a prolonged downtrend
- Mirrors the Head and Shoulders pattern in structure but signals the opposite direction
Hypothetical Example: The neckline sits at 100, the head at 90, and the right shoulder at 95.
- Confirmation: A close above 100.
- Stop-Loss: Below the right shoulder, at 94. A stop-loss does not guarantee the exit price, particularly during gaps or fast markets.
- Measured-Move Projection: 110, which is the neckline plus the head’s depth below it (100 − 90 = 10), the Head and Shoulders method in reverse.1 Price may stop short of the projection or reverse.
3. Double Top — Bearish Reversal
The Double Top pattern shows up when price attempts to break through a resistance level twice but fails both times. This creates two peaks at roughly the same level, separated by a moderate pullback.
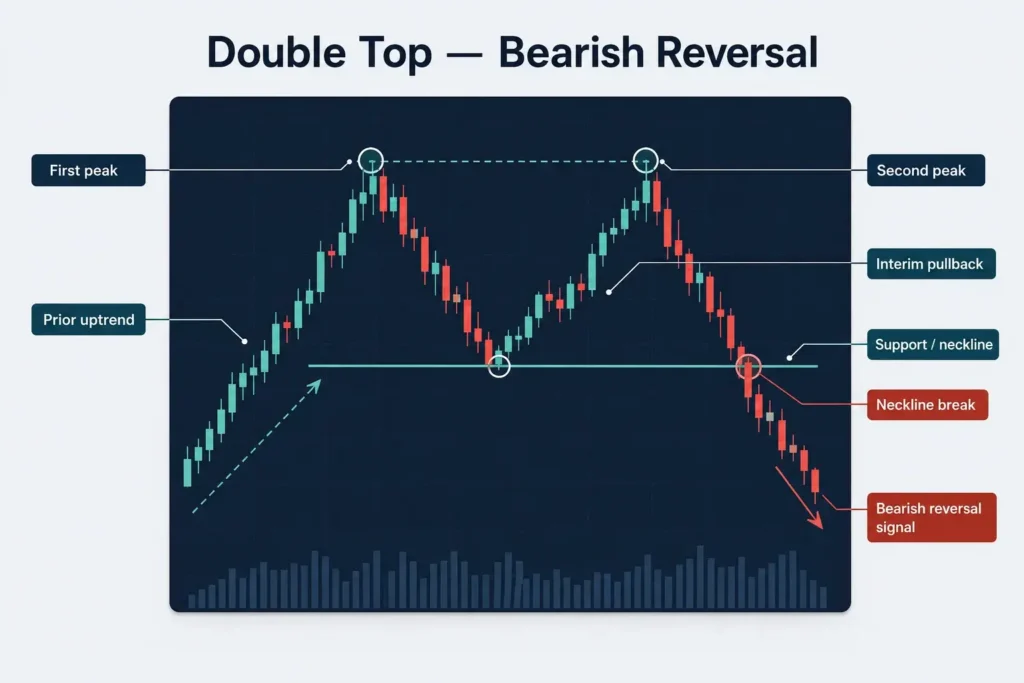
The failure to push higher is often read as a sign that the uptrend is losing momentum. Confirmation comes when price breaks below the support — or neckline — formed by the interim pullback.
Traders often interpret a Double Top as a possible sign of trend exhaustion and potential bearish momentum, particularly on daily charts.
Key features:
- Two peaks at a similar price level, separated by a pullback to an interim support level
- Confirmed once price closes below the support formed between the two peaks
- Often given more weight on daily or higher timeframes than on intraday charts
- Often forms after an extended uptrend as buying pressure fades
Hypothetical Example: Both peaks sit near 120, with support between them at 112.
- Confirmation: A close below 112.
- Stop-Loss: Above the peaks, at 121. A stop-loss does not guarantee the exit price, particularly during gaps or fast markets.
- Measured-Move Projection: 104, which is the support level minus the pattern’s height (120 − 112 = 8).2 Price may stop short of the projection or reverse.
4. Double Bottom — Bullish Reversal
The Double Bottom is the bullish counterpart to the Double Top. It forms after a downtrend when price tests a support level twice and bounces higher both times.
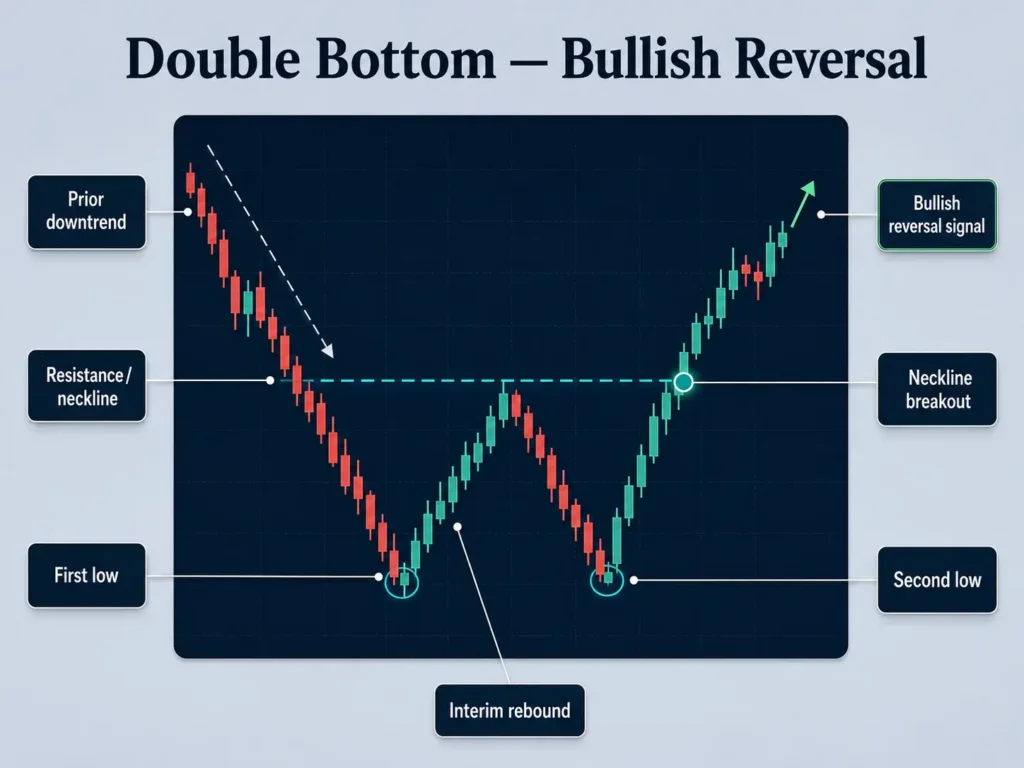
The two lows create a ‘W’ shape on the chart. This repeated rejection of lower prices suggests the balance is tilting in favour of buyers. When price breaks above the neckline, some traders view it as a potential bullish reversal.
Traders often use this pattern as a reference point when analysing markets after prolonged declines, including in major indices and commodity CFDs such as gold.
Key features:
- Two lows at a similar price level, forming a ‘W’ shape on the chart
- Confirmed once price closes above the resistance formed between the two lows
- Signals that selling pressure may be fading after a sustained downtrend
- Frequently referenced alongside the Double Top as a mirror-image pairing
Hypothetical Example: Both lows sit near 80, with resistance between them at 88.
- Confirmation: A close above 88.
- Stop-Loss: Below the lows, at 79. A stop-loss does not guarantee the exit price, particularly during gaps or fast markets.
- Measured-Move Projection: 96, which is the resistance level plus the pattern’s height (88 − 80 = 8), the Double Top method in reverse.2 Price may stop short of the projection or reverse.
5. Triple Top — Bearish Reversal
The Triple Top is a bearish reversal pattern that forms after an uptrend, when price reaches a similar high three times and fails to break above it each time.3
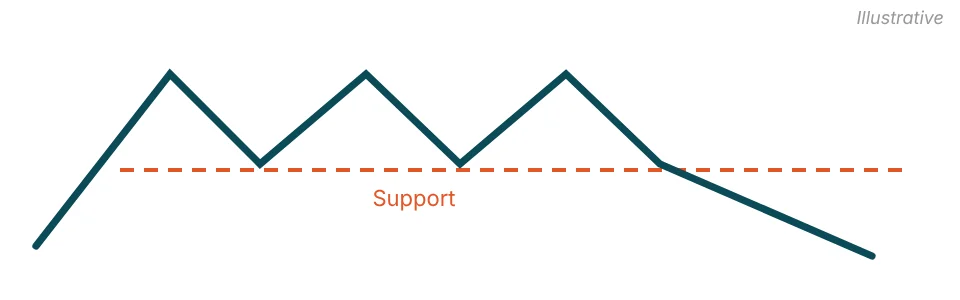
The three highs mark resistance, and the lowest low between them marks support. The pattern is generally treated as neutral until price breaks below that support, which is the usual confirmation signal.3 Traders often watch whether volume rises on the break, though volume alone does not confirm the pattern.
Because it takes longer to form than a Double Top, a Triple Top is often analysed on daily or weekly charts. StockCharts notes that it typically develops over three to six months.3
Key features:
- Three highs at a similar level, separated by two pullbacks
- Close below the lowest low between the highs is the standard confirmation signal
- Often analysed on daily or weekly charts because of the time it takes to form
- Broken support can later act as resistance if price retests it
Hypothetical Example: The three highs sit near 130, and the lowest low between them is 122.
- Confirmation: A close below 122.
- Stop-Loss: Above the highs, at 131. A stop-loss does not guarantee the exit price, particularly during gaps or fast markets.
- Measured-Move Projection: 114, which is the support level minus the pattern’s height (130 − 122 = 8).3 Price may stop short of the projection or reverse.
6. Triple Bottom — Bullish Reversal
The Triple Bottom is the bullish counterpart to the Triple Top. It forms after a downtrend, when price falls to a similar low three times and fails to break below it each time.4
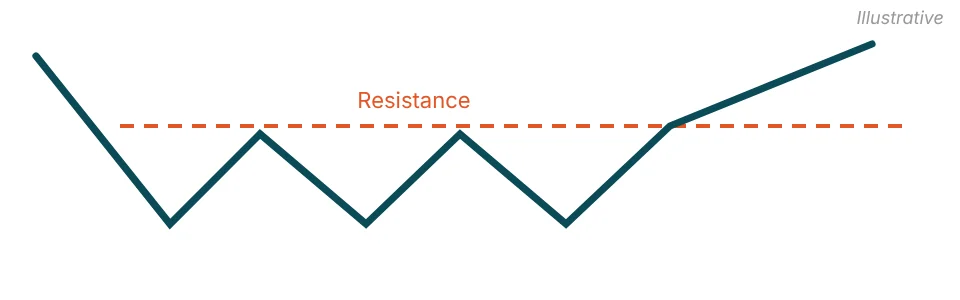
The three lows mark support, and the highest high between them marks resistance. A break above that resistance is the usual confirmation signal.4 Until then, the pattern is generally treated as neutral.
Key features:
- Three lows at a similar level, separated by two rebounds
- Close above the highest high between the lows is the standard confirmation signal
- Typically appears after a clear prior downtrend
- Broken resistance can later act as support if price retests it
Hypothetical Example: The three lows sit near 60, and the highest high between them is 66.
- Confirmation: A close above 66.
- Stop-Loss: Below the lows, at 59. A stop-loss does not guarantee the exit price, particularly during gaps or fast markets.
- Measured-Move Projection: 72, which is the resistance level plus the pattern’s height (66 − 60 = 6).4 Price may stop short of the projection or reverse.
7. Rising Wedge — Bearish Reversal or Continuation
The Rising Wedge forms when price makes higher highs and higher lows inside two upward-sloping trendlines that converge. It is generally regarded as a bearish pattern, whether it appears as a reversal after an uptrend or as a continuation during a downtrend.5
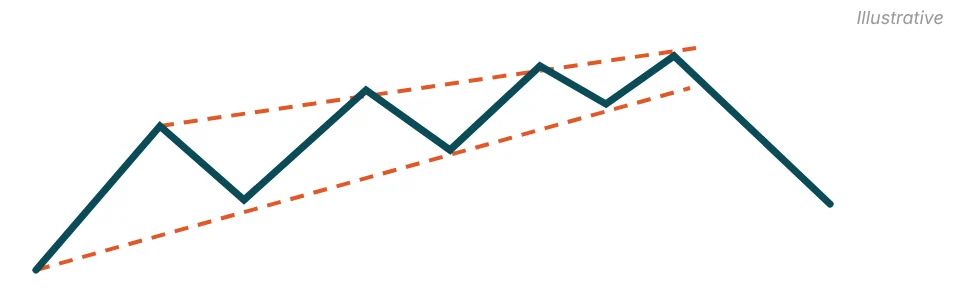
The narrowing range is often read as upward momentum fading. Confirmation usually comes when price closes below the lower trendline, and some traders look for a rise in volume on the break.5 The rising wedge pattern guide covers this formation in more detail.
Key features:
- Two upward-sloping trendlines that converge as price rises
- Close below the lower trendline is the standard confirmation signal
- Can act as a reversal after an uptrend or a continuation during a downtrend
- No standard measuring technique for estimating the move that follows
Hypothetical Example: The wedge narrows between two upward-sloping trendlines. The lower trendline sits at 45 when price breaks below it, and the most recent reaction high inside the wedge is 47.5.
- Confirmation: A close below the lower trendline, at 45.
- Stop-Loss: Above the most recent reaction high, at 48. A stop-loss does not guarantee the exit price, particularly during gaps or fast markets.
- Reference Level: StockCharts notes there is no standard measuring technique for this pattern, so traders often look to other analysis, such as an earlier support level (42 in this example).5 Price may not reach it, or may reverse before it does.
8. Falling Wedge — Bullish Reversal or Continuation
The Falling Wedge is the mirror image of the Rising Wedge. Price makes lower highs and lower lows inside two downward-sloping trendlines that converge, and the pattern is generally regarded as bullish, whether it appears as a reversal or a continuation.6
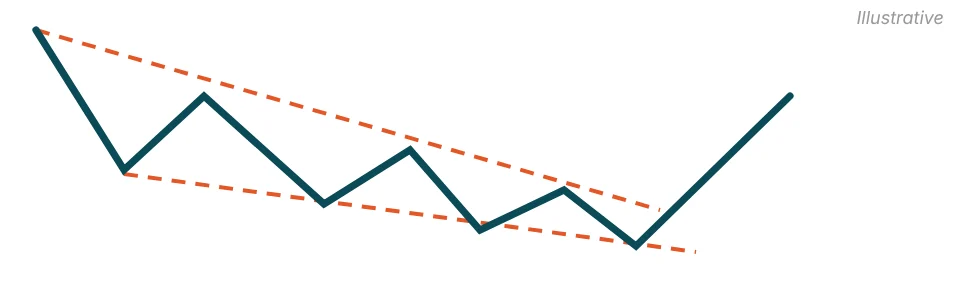
Confirmation usually comes when price closes above the upper trendline, and StockCharts describes volume as an important part of confirming the breakout.6
Key features:
- Two downward-sloping trendlines that converge as price falls
- Close above the upper trendline is the standard confirmation signal
- Can act as a reversal after a downtrend or a continuation during an uptrend
- No standard measuring technique for estimating the move that follows
Hypothetical Example: The wedge narrows between two downward-sloping trendlines. The upper trendline sits at 35 when price breaks above it, and the most recent low inside the wedge is 33.2.
- Confirmation: A close above the upper trendline, at 35.
- Stop-Loss: Below the most recent low, at 33. A stop-loss does not guarantee the exit price, particularly during gaps or fast markets.
- Reference Level: The source gives no measuring technique for this pattern, so traders often look to other analysis, such as an earlier resistance level (38 in this example).6 Price may not reach it, or may reverse before it does.
9. Rounding Bottom — Bullish Reversal
The Rounding Bottom, also called a saucer bottom, is a long-term reversal pattern in which a decline gradually flattens and turns into an advance, forming a rounded ‘U’ shape.7
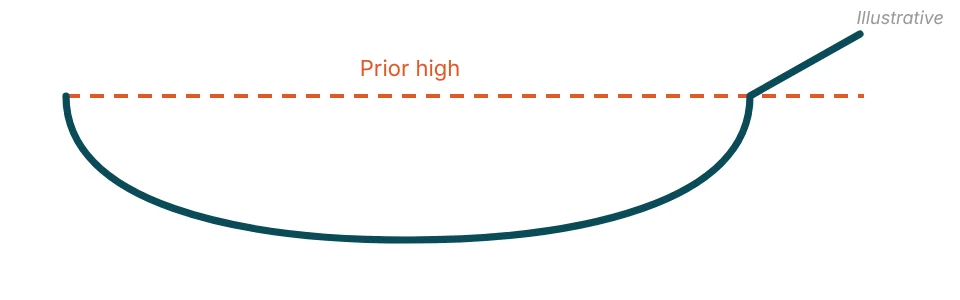
The shape is often read as a slow shift from selling to buying interest. StockCharts notes that the pattern is best suited to weekly charts, and that confirmation comes when price breaks above the high where the pattern began.7
Key features:
- Gradual, rounded low rather than a sharp ‘V’ shape
- Close above the high where the decline began is the standard confirmation signal
- Usually forms over a long period and is often analysed on weekly charts
- No standard measuring technique for estimating the move that follows
Hypothetical Example: The pattern begins at a high of 50, declines to a rounded low near 40, and then recovers. The most recent swing low on the right side of the pattern is 46.
- Confirmation: A close above 50.
- Stop-Loss: Below the most recent swing low, at 45.5. A stop-loss does not guarantee the exit price, particularly during gaps or fast markets.
- Reference Level: The source gives no measuring technique for this pattern, so traders often look to other analysis, such as an earlier resistance level (55 in this example).7 Price may not reach it, or may reverse before it does.
10. Diamond Top — Bearish Reversal
The Diamond Top forms after an uptrend, when price swings first widen and then narrow, creating a shape that looks like a diamond, usually tilted to one side.8
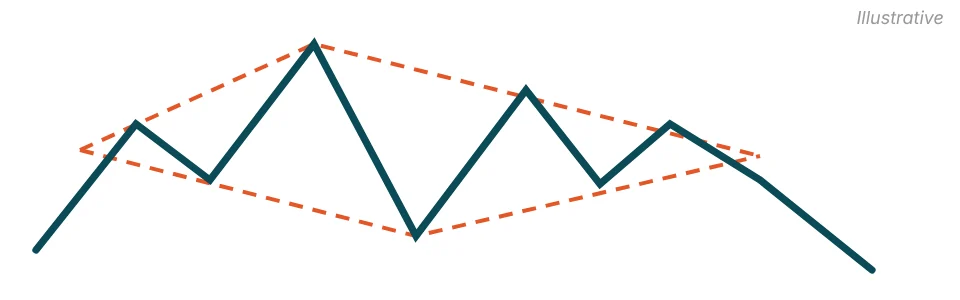
The widening and then narrowing swings are often read as rising indecision near a market high. Although the pattern is classed as a bearish reversal, price can break out of a Diamond Top in either direction, so traders usually wait for a close beyond one of its boundaries.
Key features:
- Price swings that widen and then narrow, forming a diamond shape
- Close below the lower right boundary is the bearish confirmation signal
- Can break out in either direction
- Boundaries are drawn by connecting the swing highs and lows on each side of the diamond
Hypothetical Example: The highest peak in the pattern is 90 and the lowest valley is 80. Price later breaks below the lower right boundary at 84, and the most recent swing high inside the diamond is 86.5.
- Confirmation: A close below the lower right boundary, at 84.
- Stop-Loss: Above the most recent swing high, at 87. A stop-loss does not guarantee the exit price, particularly during gaps or fast markets.
- Measured-Move Projection: 74 on a full-height basis, which is the breakout level minus the pattern’s height (90 − 80 = 10). Bulkowski’s measure rule scales this height down based on how often past patterns reached their target, which would place the projection closer to the breakout.8 Price may stop short of the projection or reverse.
11. Inverse Cup and Handle — Bearish Reversal
The Inverse Cup and Handle is the bearish counterpart to the Cup and Handle. Price forms a rounded top (the inverted cup), followed by a short upward drift (the handle).9
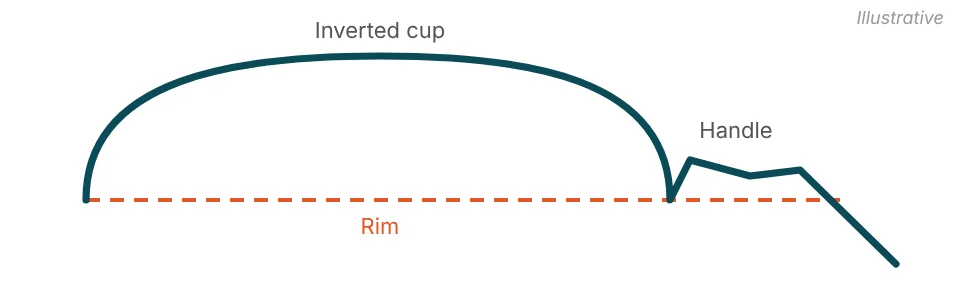
The rounded top is often read as a gradual shift from buying to selling interest. The pattern is generally treated as confirmed when price closes below the rim of the cup.9
Key features:
- Rounded ‘inverted cup’ top followed by a shorter, upward-drifting handle
- Close below the rim is the standard confirmation signal
- Often follows an advance, with the breakdown read as a possible start of a downtrend
- Bulkowski’s measure rule uses the handle’s height rather than the cup’s depth
Hypothetical Example: The rim of the cup sits at 100 and the top of the cup at 112. The handle then drifts up to 104.
- Confirmation: A close below 100.
- Stop-Loss: Above the handle’s high, at 105. A stop-loss does not guarantee the exit price, particularly during gaps or fast markets.
- Measured-Move Projection: 96, which is the rim minus the handle’s height (104 − 100 = 4).9 Price may stop short of the projection or reverse.
Continuation Patterns
Continuation patterns are read as pauses within an existing trend, after which the trend may resume.
12. Ascending Triangle — Bullish Continuation
An Ascending Triangle is a continuation pattern that reflects growing buying pressure. It is marked by a horizontal resistance line at the top and a rising trendline at the bottom.
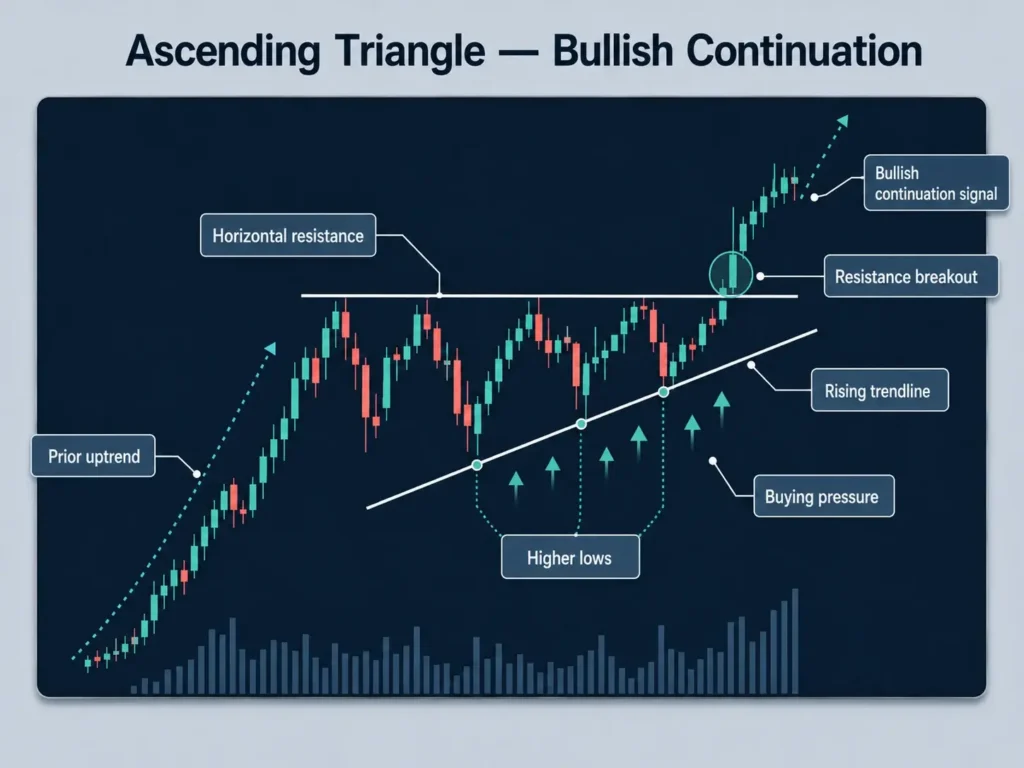
Price keeps bouncing between the two lines, forming higher lows each time. This is often read as buyers becoming more aggressive while sellers struggle to push the price lower. A breakout above the resistance line is often seen by traders as a potential continuation signal.
Traders sometimes use this setup when analysing potential uptrend conditions, and the pattern can appear in volatile instruments such as cryptocurrency or commodity CFDs.
Key features:
- Horizontal resistance line paired with a rising trendline of higher lows
- Breakout above resistance is the standard continuation signal
- Reflects increasingly aggressive buying pressure as the pattern develops
- Can appear in volatile instruments, including commodity CFDs
Hypothetical Example: Resistance sits at 50, the widest point of the triangle spans 46 to 50, and the most recent higher low is 48.5.
- Confirmation: A close above 50.
- Stop-Loss: Below the most recent higher low, at 48. A stop-loss does not guarantee the exit price, particularly during gaps or fast markets.
- Measured-Move Projection: 54, which is the breakout level plus the triangle’s widest distance (4).10 Price may stop short of the projection or reverse.
13. Descending Triangle — Bearish Continuation
The Descending Triangle is the mirror counterpart to the Ascending Triangle, and a pattern often grouped with downtrend chart patterns. The support level stays flat at the bottom, while the resistance line slopes downward.
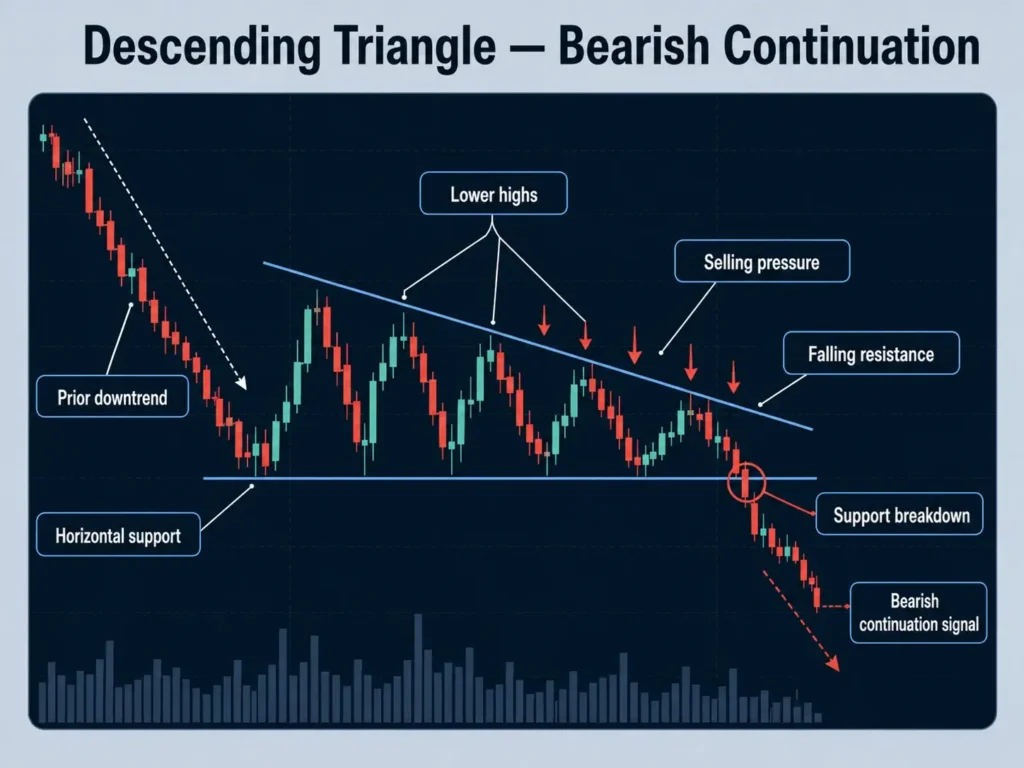
Price continues to form lower highs, often read as sellers steadily pushing the market down. If support gives way, the pattern is treated as complete.
This is commonly interpreted as a bearish continuation signal, though outcomes are never guaranteed, and the pattern is often seen during market corrections or bearish phases in stocks and indices.
Key features:
- Flat horizontal support paired with a downward-sloping resistance line
- Breakdown below support is the standard continuation signal
- Reflects persistent selling pressure as lower highs continue to form
- Often grouped with other downtrend chart patterns during broad market corrections
Hypothetical Example: Support sits at 50, the widest point of the triangle spans 50 to 54, and the most recent lower high is 51.5.
- Confirmation: A close below 50.
- Stop-Loss: Above the most recent lower high, at 52. A stop-loss does not guarantee the exit price, particularly during gaps or fast markets.
- Measured-Move Projection: 46, which is the breakdown level minus the triangle’s widest distance (4), the Ascending Triangle method in reverse.10 Price may stop short of the projection or reverse.
14. Bull Flag — Bullish Continuation
A Bull Flag occurs after a strong price rise, marked by the ‘flagpole.’ Following this sharp rally, the market consolidates in a small rectangular shape that slopes slightly against the trend, before price may continue higher.
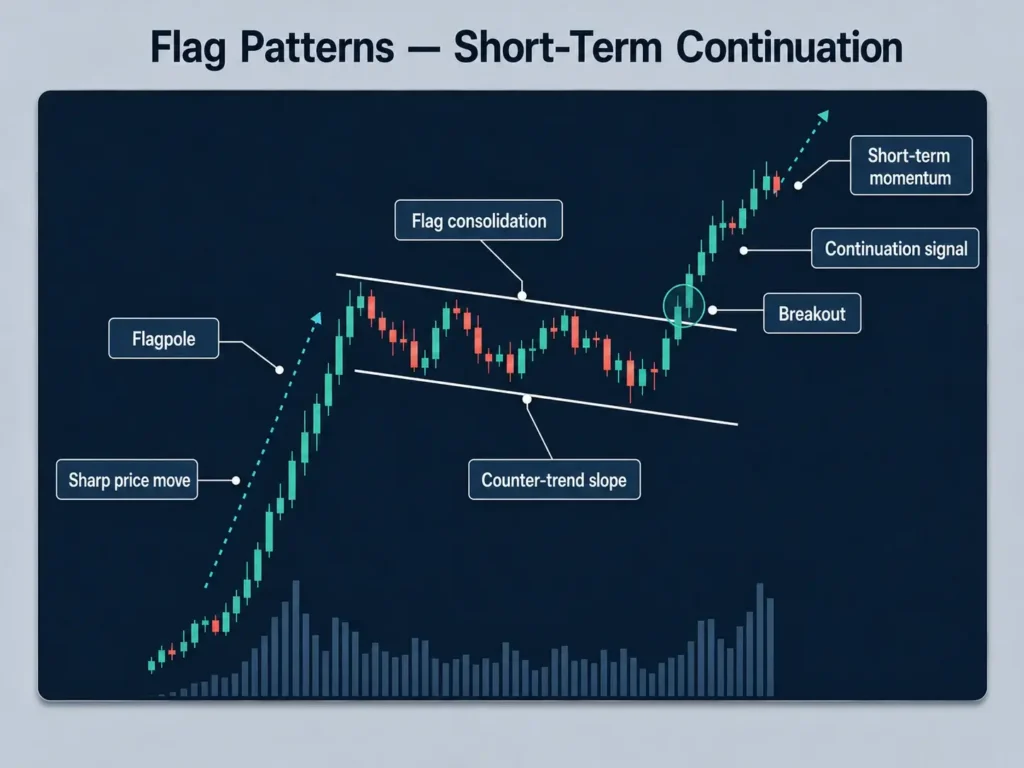
Bull flags are commonly interpreted as short-term continuation signals and are often watched on shorter timeframes. A breakout from the flag is usually interpreted as a potential continuation, though the outcome may vary.
Key features:
- Small rectangular consolidation that slopes against the preceding trend
- Forms after a sharp, near-vertical price move (the ‘flagpole’)
- A breakout is commonly expected in the direction of the flagpole, though it can fail
- Often watched on shorter timeframes as a momentum pattern
Hypothetical Example: A flagpole rises from 30 to 36, and the flag then drifts lower to 34.3 before price breaks its upper boundary at 35.5.
- Confirmation: A close above the flag’s upper boundary.
- Stop-Loss: Below the flag’s low, at 34. A stop-loss does not guarantee the exit price, particularly during gaps or fast markets.
- Measured-Move Projection: 41.5, which is the breakout level plus the flagpole’s length (6).11 Price may stop short of the projection or reverse.
15. Bear Flag — Bearish Continuation
The Bear Flag is the bearish counterpart to the Bull Flag. It forms after a sharp price fall (the flagpole), followed by a small rectangular consolidation that slopes slightly upward, against the trend.
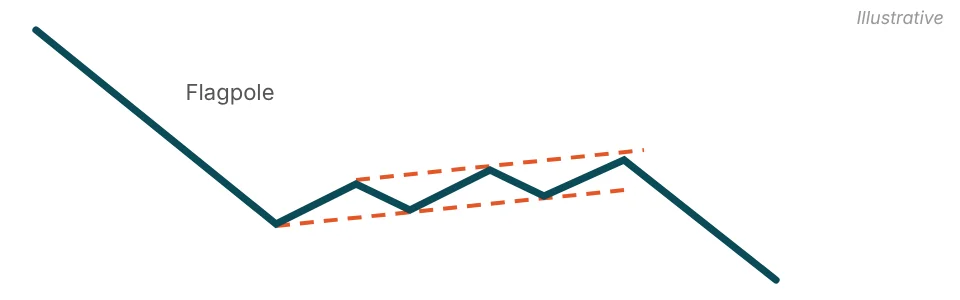
A breakdown below the flag is commonly interpreted as a possible continuation of the fall, though it can fail. The bear flag pattern guide covers this formation in more detail.
Key features:
- Small rectangular consolidation that slopes upward, against the preceding fall
- Forms after a sharp, near-vertical price decline (the ‘flagpole’)
- Close below the flag’s lower boundary is the standard confirmation signal
- Often watched on shorter timeframes as a momentum pattern
Hypothetical Example: A flagpole falls from 80 to 72, and the flag then drifts higher to 74.8 before price breaks its lower boundary at 73.5.
- Confirmation: A close below the flag’s lower boundary.
- Stop-Loss: Above the flag’s high, at 75. A stop-loss does not guarantee the exit price, particularly during gaps or fast markets.
- Measured-Move Projection: 65.5, which is the breakdown level minus the flagpole’s length (8).11 Price may stop short of the projection or reverse.
16. Pennant Patterns — Compact Continuation
Pennants are similar to flags but form a small triangular rather than rectangular shape. After a steep price movement, price consolidates into a small symmetrical triangle that slopes neither clearly up nor down.
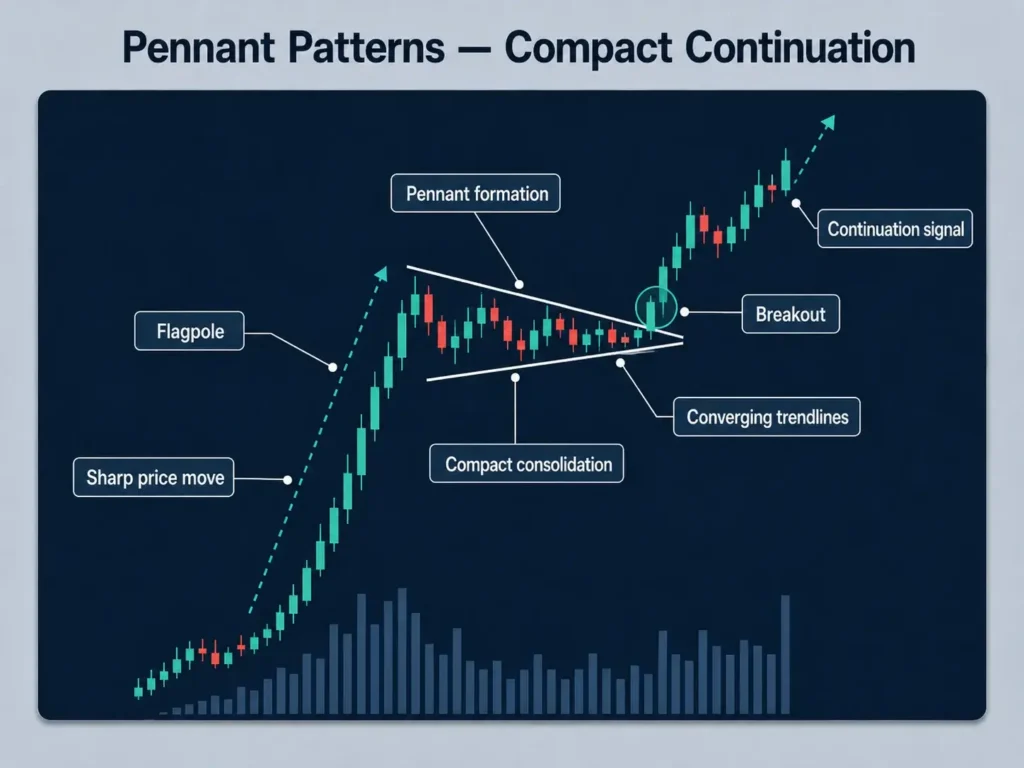
Like flags, pennants are read as a pause in which the previous trend may resume. They are shorter in duration and sharper in formation than larger triangles, making them a formation some traders monitor when assessing possible short-term continuation.
A breakout from the pennant is commonly viewed as a possible continuation, but this is not always the case.
Key features:
- Small symmetrical triangle that forms after a sharp price move
- Shorter in duration than a standard Symmetrical Triangle
- A breakout is commonly expected in the direction of the prior move, though it can fail
- Easily confused with flags — the triangular shape is the main distinguishing feature
Hypothetical Example: A flagpole rises from 70 to 77, and the pennant narrows between 75.5 and 76.5 before price breaks out at 76.5.
- Confirmation: A close above the pennant’s upper trendline.
- Stop-Loss: Below the pennant’s low, at 75. A stop-loss does not guarantee the exit price, particularly during gaps or fast markets.
- Measured-Move Projection: 83.5, which is the breakout level plus the flagpole’s length (7).11 Price may stop short of the projection or reverse.
17. Cup and Handle — Bullish Continuation
The Cup and Handle is a bullish continuation pattern that often appears in equities during long-term uptrends.
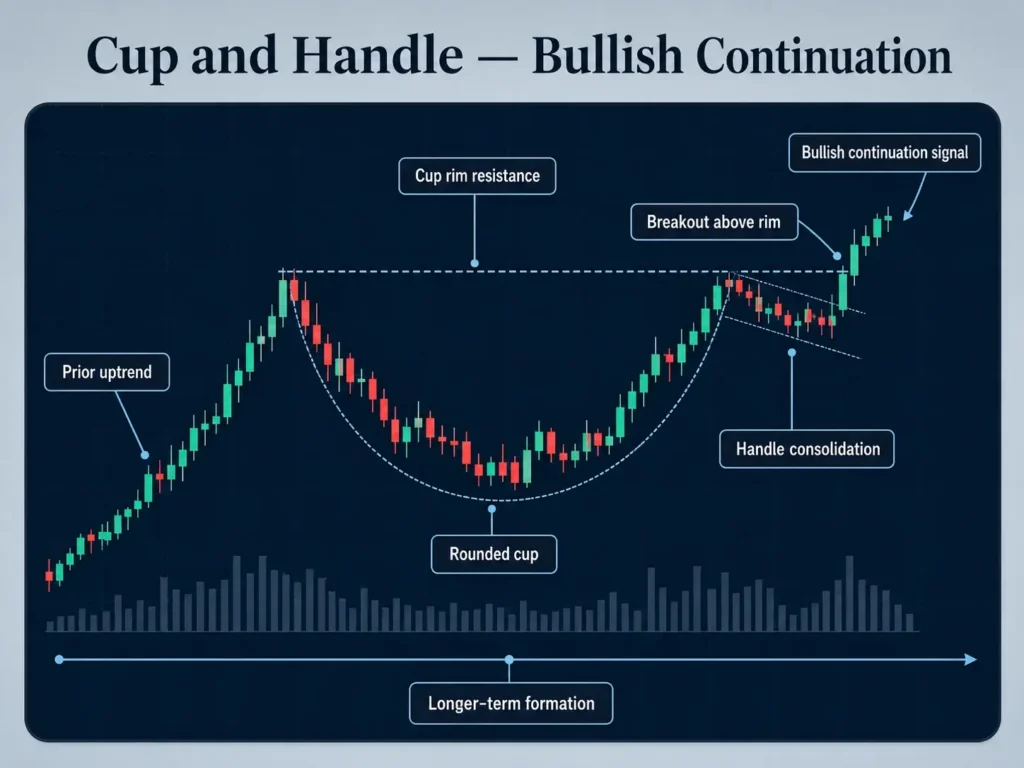
The ‘cup’ looks like a rounded bottom, showing a gradual shift from selling to buying interest. After this slow recovery, a small pullback forms the ‘handle,’ usually a short consolidation before a breakout higher.
Once price clears the resistance at the rim of the cup, traders may interpret the pattern as confirmed, though it may still fail. Some traders watch this setup in equity CFDs during long-term uptrends, though outcomes may vary.
Key features:
- Rounded ‘cup’ base followed by a shorter ‘handle’ consolidation
- Breakout above the cup’s resistance rim is the standard confirmation signal
- Most associated with long-term uptrends in individual equities
- Can take weeks to months to complete on higher timeframes
Hypothetical Example: The rim of the cup sits at 100, the bottom at 85, and the handle pulls back to 96.
- Confirmation: A close above 100.
- Stop-Loss: Below the handle’s low, at 95. A stop-loss does not guarantee the exit price, particularly during gaps or fast markets.
- Measured-Move Projection: 115, which is the rim plus the cup’s depth (15).12 Price may stop short of the projection or reverse.
18. Rectangle — Continuation
A Rectangle forms during a pause in a trend, when price moves sideways between two comparable highs and two comparable lows that can be joined by parallel horizontal lines.13
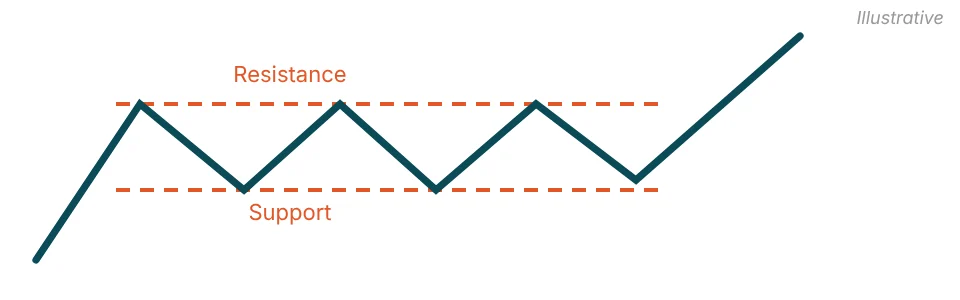
The pattern is incomplete until price breaks out, and the direction of the next move is only known once it does.13 It is usually classed as a continuation pattern, but it can break in either direction, so traders often wait for a close beyond the range.
Key features:
- Horizontal support and resistance lines that run parallel
- Close beyond the top or bottom of the range is the standard confirmation signal
- Usually forms after an existing trend
- Some traders add a price, time, or volume filter before treating a breakout as valid13
Hypothetical Example: Price moves sideways between support at 20 and resistance at 24, then breaks above the range.
- Confirmation: A close above 24. A close below 20 would be read the same way in reverse.
- Stop-Loss: Back inside the range, at 23. A stop-loss does not guarantee the exit price, particularly during gaps or fast markets.
- Measured-Move Projection: 28, which is the breakout level plus the range’s height (24 − 20 = 4).13 Price may stop short of the projection or reverse.
Bilateral Patterns
Bilateral patterns can break in either direction, so traders usually wait for a confirmed breakout before reading a direction.
19. Symmetrical Triangle — Bilateral Consolidation
The Symmetrical Triangle is a bilateral chart pattern that forms when buyers and sellers are roughly equally matched.
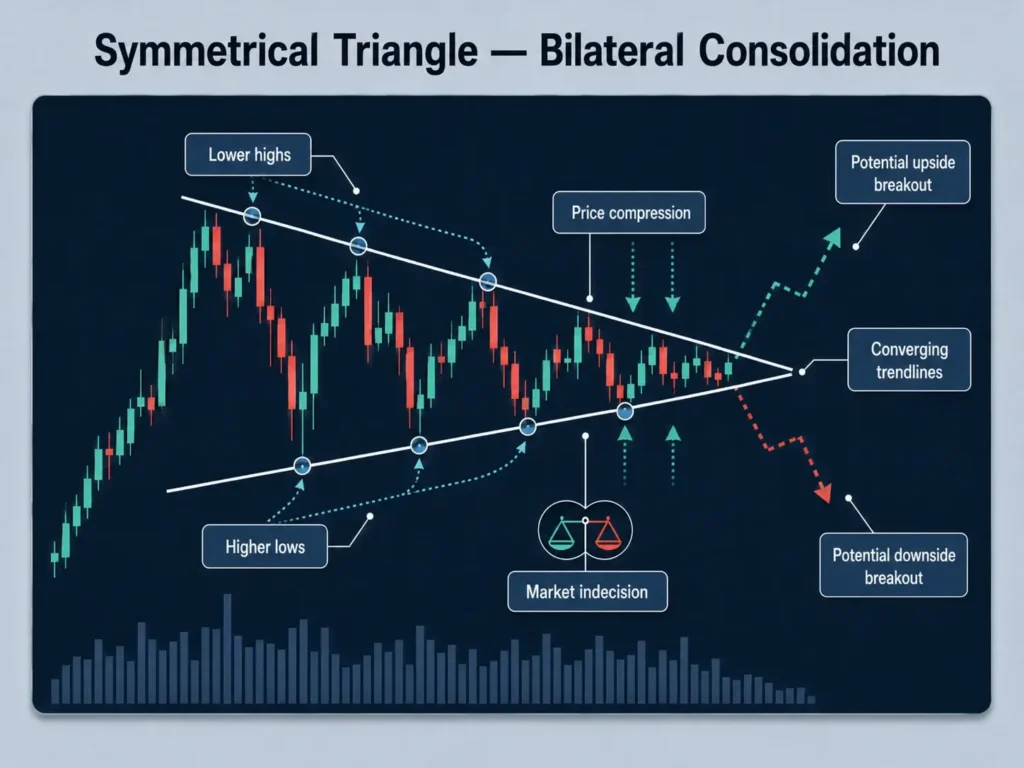
Price squeezes into a narrowing range, with lower highs and higher lows creating two converging trendlines. This is often read as indecision in the market, often occurring during consolidation phases.
While the direction of the eventual breakout is uncertain, the move that follows can be sharp. Traders often wait for a confirmed breakout above resistance or below support, and frequently use a secondary indicator — such as the Money Flow Index or Relative Volume — to help confirm direction once it emerges.
Key features:
- Two converging trendlines formed by lower highs and higher lows
- Breakout direction is not predetermined, unlike continuation or reversal patterns
- Often paired with a secondary indicator to help confirm the breakout direction
- Can be followed by a sharp move once it resolves, in either direction
Hypothetical Example: The triangle is widest between 56 and 64, and price later breaks above the upper trendline at 61.
- Confirmation: A close above the upper trendline. A break below the lower trendline would be read the same way in reverse.
- Stop-Loss: Below the lower trendline near the breakout point, at 59. A stop-loss does not guarantee the exit price, particularly during gaps or fast markets.
- Measured-Move Projection: 69, which is the breakout point plus the triangle’s widest distance (8).14 Price may stop short of the projection or reverse.
20. Broadening Formation — Bilateral
A Broadening Formation, also called a megaphone pattern, forms when price makes a series of higher highs and lower lows, so that its trendlines diverge rather than converge.15
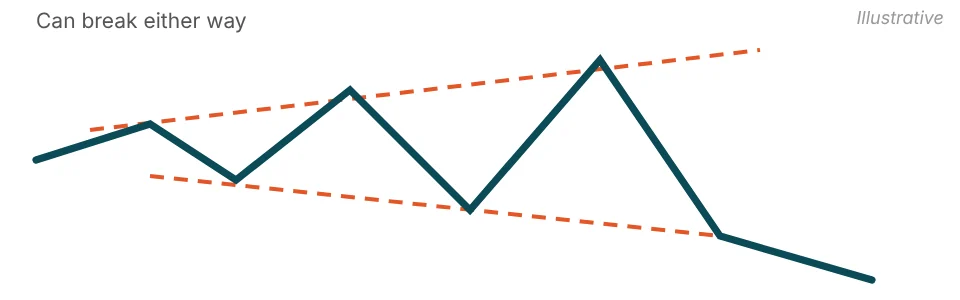
The widening swings are often read as growing volatility and disagreement between buyers and sellers. StockCharts lists the broadening top among reversal patterns but notes that a breakout can occur in either direction,15 so it is grouped with the bilateral patterns here.
Key features:
- Higher highs and lower lows between two diverging trendlines
- Close beyond either trendline is the confirmation signal
- Price swings tend to widen as the pattern develops
- StockCharts suggests at least five touches of the trendlines in total15
Hypothetical Example: The highest peak in the pattern is 58 and the lowest valley is 46. Price later breaks below the lower trendline at 47, and the most recent swing high inside the pattern is 52.
- Confirmation: A close below the lower trendline. A break above the upper trendline would be read the same way in reverse.
- Stop-Loss: Above the most recent swing high, at 53. A stop-loss does not guarantee the exit price, particularly during gaps or fast markets.
- Measured-Move Projection: 34, which is the pattern’s lowest point minus its height (58 − 46 = 12).15 Price may stop short of the projection or reverse.
A Real Chart Pattern Example: Gold’s 2026 Head and Shoulders
Chart pattern mechanics are easier to recognise when matched against a real, dated example rather than a textbook illustration.
In a technical note published on 11 May 2026, Reuters market analyst Wang Tao described a Head and Shoulders pattern on spot gold (XAU/USD) with a neckline around $4,678 per ounce. He said spot gold may break that level and fall toward $4,601, with resistance at $4,714, and that the pattern would be confirmed only once the market broke the neckline.16 Price moves in gold can also be traded through gold CFDs, which carry a high risk of loss due to leverage.
The setup illustrates the same mechanics covered earlier in this guide: three peaks, a neckline connecting the lows between them, and a target projected from the pattern. The note described a possible move rather than a completed one, and patterns can and do fail, particularly around high-impact news events. The gold example shows how analysts apply the formation to a live, liquid market rather than a hypothetical chart.
The above example is for illustrative purposes only and does not constitute a recommendation to buy, sell, or hold any financial instrument. Past performance is not a reliable indicator of future results.
How Traders Use Chart Patterns
Recognising and knowing how to read a chart pattern is only the first step; traders who use chart patterns typically wait for confirmation.
A common approach is to wait for confirmation before entering a trade. For example, in a Head and Shoulders pattern, the setup isn’t complete until price breaks below the neckline. Jumping in too early can expose a trader to false signals, where the market appears to form a pattern but doesn’t follow through. Confirmation, often paired with a rise in trading volume, can help filter out some false setups, though it does not remove them.
Chart patterns are generally considered alongside other technical indicators. The Relative Strength Index (RSI) can highlight whether a market is overbought or oversold, while MACD can signal momentum shifts that align with the breakout.
Moving averages are also used to confirm the broader trend direction. For example, if a bullish Triangle breakout happens above the 200-day moving average, some traders give it more weight than one that forms during a downtrend. Combining chart patterns with these indicators can help build a more complete picture of market conditions.
Another critical aspect of using chart patterns is risk management. No chart pattern or technical indicator is fool-proof, and even well-formed chart patterns can fail, especially in volatile markets.
Some traders use stop-loss orders placed just beyond the boundaries of the pattern, such as below the support in a Double Bottom or above the resistance in a Double Top, so that a position is closed if the market moves against it. A stop-loss does not guarantee the exit price, particularly during gaps or fast markets, so a loss can be larger than planned.
Position sizing matters too; many traders manage risk by limiting their exposure on individual trades to manage the potential impact of losses, although this does not remove the risk of loss. False breakouts happen, so managing risk matters as much as identifying the pattern.
3 Common Mistakes Traders Make With Chart Patterns
Even though chart patterns are widely used in technical analysis, they are not foolproof. Traders often fall into predictable traps when applying them. Understanding these common mistakes can help in recognising why certain setups fail and why patience and context matter when analysing charts.
1. Entering a Trade Too Early
One mistake is entering too early, before the pattern is confirmed. When a potential pattern begins to form, it can be tempting to place a trade in the direction the pattern appears to indicate.
However, this can be a mistake — until the breakout occurs, the pattern is incomplete. Premature entries often lead to being caught in false setups, where price briefly teases the pattern before snapping back in the opposite direction.
Waiting for confirmation means acting on a completed pattern rather than a partial one, though a confirmed pattern can still fail.
2. Ignoring Timeframe Relevance
Another common pitfall is ignoring timeframe relevance. Chart patterns can appear on any timeframe, from one-minute charts to weekly charts, but not all carry the same significance.
A Head and Shoulders pattern forming on a daily chart represents weeks of market activity and reflects the consensus of many traders and institutions, which is why traders often give it more weight. By contrast, the same pattern on a five-minute chart may only reflect a short burst of volatility or noise, which can reverse just as quickly as it appeared.
Traders who rely only on short-term setups without considering the bigger picture risk making trades that go against the dominant trend. Aligning smaller patterns with higher-timeframe trends is one way traders try to filter out weaker signals, though it does not remove the risk of loss.
3. Over-Reliance on Chart Patterns
Finally, traders may fall into the trap of over-relying on chart patterns while ignoring fundamentals.
Technical analysis has limits, and it does not operate in a vacuum. Economic news, earnings reports, central bank decisions, and geopolitical events can all invalidate a pattern within seconds.
A clean Triangle Breakout in a forex pair can fail instantly if unexpected interest rate news hits the market. Combining technical signals with awareness of market fundamentals — the focus of fundamental analysis — can help put price action in real-world context.
Making Chart Patterns Work for You
Chart patterns give traders a window into the psychology of the market. They illustrate where buyers appear to step in, where sellers hold ground, and where momentum may be shifting beneath the surface.
That said, chart patterns are not crystal balls. Traders typically use them alongside confirmation signals, sound risk management, and a healthy respect for market fundamentals — the same principles that apply whether someone is trading chart patterns in forex, indices, or commodities.
Studying chart patterns can help you recognise the shapes on a chart and the behaviour often associated with them, such as fear, greed, hesitation, and conviction. The free chart patterns cheat sheet summarises all 20 on three pages. For more on related topics, including candlestick patterns and fundamental analysis, see the rest of the Vantage Academy.
Frequently Asked Questions
The answers below cover common questions about identifying and reading chart patterns.
How Many Chart Patterns Are There?
There is no single fixed number, since traders and analysts have documented many variations of the same core formations over the decades. This guide covers 20 formations seen across forex, stocks, indices, and commodity CFDs, from Head and Shoulders and Double Tops to the wedges, the flags, and the Broadening Formation. Some traders also study other variants, such as the Bump and Run Reversal and harmonic patterns.
What Is the Difference Between Continuation, Reversal, and Bilateral Chart Patterns?
Continuation patterns, such as flags and triangles, suggest a pause before the existing trend resumes. Reversal patterns, such as Head and Shoulders or Double Tops, suggest a trend may be losing momentum and turning the other way. Bilateral patterns, such as the Symmetrical Triangle, reflect genuine uncertainty — the breakout direction is not predetermined by the pattern itself.
How Do You Read a Chart Pattern?
Reading a chart pattern starts with identifying the shape forming from connected swing highs and lows, then locating the relevant support, resistance, or neckline level. From there, most traders wait for a confirmed breakout — a close beyond that level — rather than acting on the shape alone, and often check whether trading volume rises alongside the breakout for added confirmation.
How Do You Draw Chart Patterns on a Chart?
Chart patterns are typically drawn using trendlines: a line connecting swing highs marks resistance, and a line connecting swing lows marks support. For reversal patterns like Head and Shoulders or Double Tops, a separate neckline is drawn by connecting the interim lows or highs between the peaks or troughs that make up the pattern.
What Is the Difference Between Chart Patterns and Candlestick Patterns?
Chart patterns form over many price bars or candles — sometimes weeks or months — and are defined by trendlines connecting multiple swing highs and lows, such as a Head and Shoulders or a Triangle. Candlestick patterns, by contrast, form from one or a handful of individual candles and are read over a much shorter window. The two are often used together rather than as substitutes for one another.
What Is the Most Reliable Chart Pattern?
No chart pattern is reliable in every market condition, and past performance is not a reliable indicator of future results. Head and Shoulders, Double Tops, and Double Bottoms each have a defined neckline and a measured-move projection, which makes them straightforward to describe, but that does not make them more likely to succeed. Many traders treat a confirmed breakout, ideally with rising volume, as more important than the pattern type itself.
RISK WARNING: CFDs are complex financial instruments and carry a high risk of losing money rapidly due to leverage. You should ensure you fully understand the risks involved and carefully consider whether you can afford to take the high risk of losing your money before trading.
Disclaimer: The information is provided for educational purposes only and doesn’t take into account your personal objectives, financial circumstances, or needs. It does not constitute investment advice. We encourage you to seek independent advice if necessary. The information has not been prepared in accordance with legal requirements designed to promote the independence of investment research. No representation or warranty is given as to the accuracy or completeness of any information contained within. This material may contain historical or past performance figures and should not be relied on. Furthermore, estimates, forward-looking statements, and forecasts cannot be guaranteed. The information on this site and the products and services offered are not intended for distribution to any person in any country or jurisdiction where such distribution or use would be contrary to local law or regulation.
References
- “Head and Shoulders Top – StockCharts ChartSchool” https://chartschool.stockcharts.com/table-of-contents/chart-analysis/chart-patterns/head-and-shoulders-top. Accessed on 18 November 2026.
- “Double Top Reversal – StockCharts ChartSchool” https://chartschool.stockcharts.com/table-of-contents/chart-analysis/chart-patterns/double-top-reversal. Accessed on 18 November 2026.
- “Triple Top Reversal – StockCharts ChartSchool” https://chartschool.stockcharts.com/table-of-contents/chart-analysis/chart-patterns/triple-top-reversal. Accessed on 18 November 2026.
- “Triple Bottom Reversal – StockCharts ChartSchool” https://chartschool.stockcharts.com/table-of-contents/chart-analysis/chart-patterns/triple-bottom-reversal. Accessed on 18 November 2026.
- “Rising Wedge – StockCharts ChartSchool” https://chartschool.stockcharts.com/table-of-contents/chart-analysis/chart-patterns/rising-wedge. Accessed on 18 November 2026.
- “Falling Wedge – StockCharts ChartSchool” https://chartschool.stockcharts.com/table-of-contents/chart-analysis/chart-patterns/falling-wedge. Accessed on 18 November 2026.
- “Rounding Bottom – StockCharts ChartSchool” https://chartschool.stockcharts.com/table-of-contents/chart-analysis/chart-patterns/rounding-bottom. Accessed on 18 November 2026.
- “Diamond Tops – Thomas N. Bulkowski, ThePatternSite” https://www.thepatternsite.com/diamondt.html. Accessed on 18 November 2026.
- “Inverted Cup with Handle – Thomas N. Bulkowski, ThePatternSite” https://thepatternsite.com/icup.html. Accessed on 18 November 2026.
- “Ascending Triangle – StockCharts ChartSchool” https://chartschool.stockcharts.com/table-of-contents/chart-analysis/chart-patterns/ascending-triangle. Accessed on 18 November 2026.
- “Flag, Pennant – StockCharts ChartSchool” https://chartschool.stockcharts.com/table-of-contents/chart-analysis/chart-patterns/flag-pennant. Accessed on 18 November 2026.
- “Cup With Handle – StockCharts ChartSchool” https://chartschool.stockcharts.com/table-of-contents/chart-analysis/chart-patterns/cup-with-handle. Accessed on 18 November 2026.
- “Rectangle – StockCharts ChartSchool” https://chartschool.stockcharts.com/table-of-contents/chart-analysis/chart-patterns/rectangle. Accessed on 18 November 2026.
- “Symmetrical Triangle – StockCharts ChartSchool” https://chartschool.stockcharts.com/table-of-contents/chart-analysis/chart-patterns/symmetrical-triangle. Accessed on 18 November 2026.
- “Broadening Top – StockCharts ChartSchool” https://chartschool.stockcharts.com/table-of-contents/chart-analysis/chart-patterns/broadening-top-or-megaphone-top. Accessed on 18 November 2026.
- “Spot gold targets $4,601 after head-and-shoulders completion – Reuters (via TradingView)” https://www.tradingview.com/news/reuters.com,2026:newsml_L1N41O02A:0-spot-gold-targets-4-601-after-head-and-shoulders-completion/. Published on 11 May 2026. Accessed on 18 November 2026.
Key Points In This Article

Latest Academy Articles


Market News Tags
- # Asian Market News Today
- # Crude Oil News Today
- # Earnings News Today
- # Economic News Today
- # Featured News
- # Federal Reserve News
- # Commodity Market News
- # Interest Rate News
- # Financial News
- # Forex News Today
- # Gold News Today
- # Market News Today
Related Articles
- Gold Trading Hours: When Does the Gold Market Open in Peru?
- Gold Trading Hours: When Does the Gold Market Open in Chile?
- Gold Trading Hours: When Does the Gold Market Open in Argentina?
- Gold Trading Hours: When Does the Gold Market Open in Mexico?
- What Is Trading Psychology? 5 Habits & 5 Pitfalls (Free PDF)
- What Moves Synthetic Indices? Unpacking Their Algorithmic Nature
- Best Copy Trading Apps and Platforms in Mexico: 8 Compared
- Best Copy Trading Apps and Platforms in Chile: 10 Compared